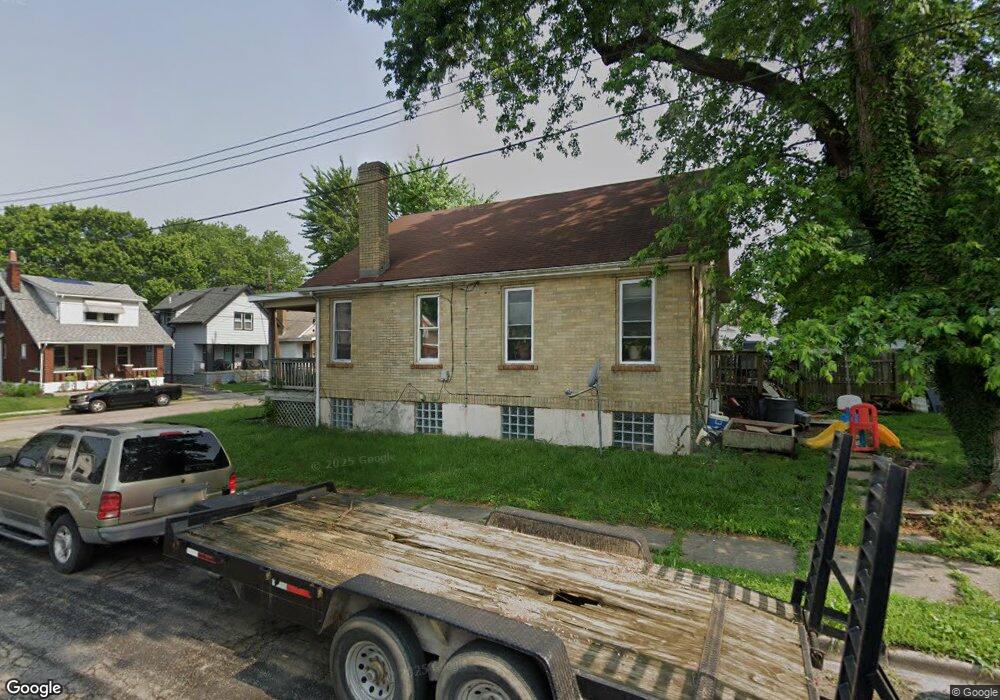
5328 Hunter Ave Cincinnati, OH 45212
Estimated Value: $98,000 - $197,000
3
Beds
2
Baths
1,088
Sq Ft
$145/Sq Ft
Est. Value
About This Home
This home is located at 5328 Hunter Ave, Cincinnati, OH 45212 and is currently estimated at $157,995, approximately $145 per square foot. 5328 Hunter Ave is a home located in Hamilton County with nearby schools including Norwood High School, Cornerstone Christian Academy, and Immaculate Conception Academy.
Ownership History
Date
Name
Owned For
Owner Type
Purchase Details
Closed on
Oct 27, 2009
Sold by
Dehler Paul E and Dehler Diane M
Bought by
Dehler Rentals Llc
Current Estimated Value
Purchase Details
Closed on
Jul 23, 2009
Sold by
Dehler Rentals Llc
Bought by
Dehler Paul E and Dehler Diane M
Home Financials for this Owner
Home Financials are based on the most recent Mortgage that was taken out on this home.
Original Mortgage
$78,688
Outstanding Balance
$49,982
Interest Rate
5.11%
Mortgage Type
New Conventional
Estimated Equity
$108,013
Purchase Details
Closed on
Dec 11, 2008
Sold by
Dehler Paul and Dehler Diane M
Bought by
Dehler Rentals Llc
Purchase Details
Closed on
May 8, 1998
Sold by
Fifth Third Investment Company
Bought by
Dehler Paul
Purchase Details
Closed on
Oct 9, 1997
Sold by
Leis Simon L and Geraci Teri L
Bought by
Fifth Third Bank
Create a Home Valuation Report for This Property
The Home Valuation Report is an in-depth analysis detailing your home's value as well as a comparison with similar homes in the area
Home Values in the Area
Average Home Value in this Area
Purchase History
| Date | Buyer | Sale Price | Title Company |
|---|---|---|---|
| Dehler Rentals Llc | -- | Attorney | |
| Dehler Paul E | -- | Attorney | |
| Dehler Rentals Llc | -- | Attorney | |
| Dehler Paul | $39,000 | Vintage Title Agency Inc | |
| Fifth Third Bank | $40,000 | -- |
Source: Public Records
Mortgage History
| Date | Status | Borrower | Loan Amount |
|---|---|---|---|
| Open | Dehler Paul E | $78,688 |
Source: Public Records
Tax History
| Year | Tax Paid | Tax Assessment Tax Assessment Total Assessment is a certain percentage of the fair market value that is determined by local assessors to be the total taxable value of land and additions on the property. | Land | Improvement |
|---|---|---|---|---|
| 2025 | $2,406 | $45,189 | $9,968 | $35,221 |
| 2023 | $2,420 | $45,189 | $9,968 | $35,221 |
| 2022 | $1,814 | $28,518 | $7,553 | $20,965 |
| 2021 | $1,799 | $28,518 | $7,553 | $20,965 |
| 2020 | $1,759 | $28,518 | $7,553 | $20,965 |
| 2019 | $1,677 | $25,015 | $6,626 | $18,389 |
| 2018 | $1,678 | $25,015 | $6,626 | $18,389 |
| 2017 | $1,604 | $25,015 | $6,626 | $18,389 |
| 2016 | $1,939 | $28,869 | $6,227 | $22,642 |
| 2015 | $1,714 | $28,869 | $6,227 | $22,642 |
| 2014 | $1,706 | $28,869 | $6,227 | $22,642 |
| 2013 | $1,795 | $30,713 | $6,626 | $24,087 |
Source: Public Records
Map
Nearby Homes
- 5310 Globe Ave
- 5258 Hunter Ave
- 5405 Carthage Ave
- 2119 Cathedral Ave
- 5255 Rolston Ave
- 5234 Hunter Ave
- 2115 Quatman Ave
- 5314 Section Ave
- 2150 Drex Ave
- 1966 Avonlea Ave
- 2106 Lawn Ave
- 2156 Quatman Ave
- 5203 Rolston Ave
- 2171 Glenside Ave
- 5126 Globe Ave
- 5123 Globe Ave
- 2229 Feldman Ave
- 2011 Dale Rd
- 5121 Rolston Ave
- 1945 Lawn Ave
- 5330 Hunter Ave
- 5332 Hunter Ave
- 5322 Hunter Ave
- - Hunter Ave
- 5334 Hunter Ave
- 5329 Globe Ave
- 5314 Hunter Ave
- 5331 Globe Ave
- 5335 Globe Ave
- 5319 Globe Ave
- 5338 Hunter Ave
- 5337 Globe Ave
- 5312 Hunter Ave
- 5329 Hunter Ave
- 5317 Globe Ave
- 5331 Hunter Ave
- 5319 Hunter Ave
- 5342 Hunter Ave
- 5317 Hunter Ave
- 5315 Globe Ave
Your Personal Tour Guide
Ask me questions while you tour the home.