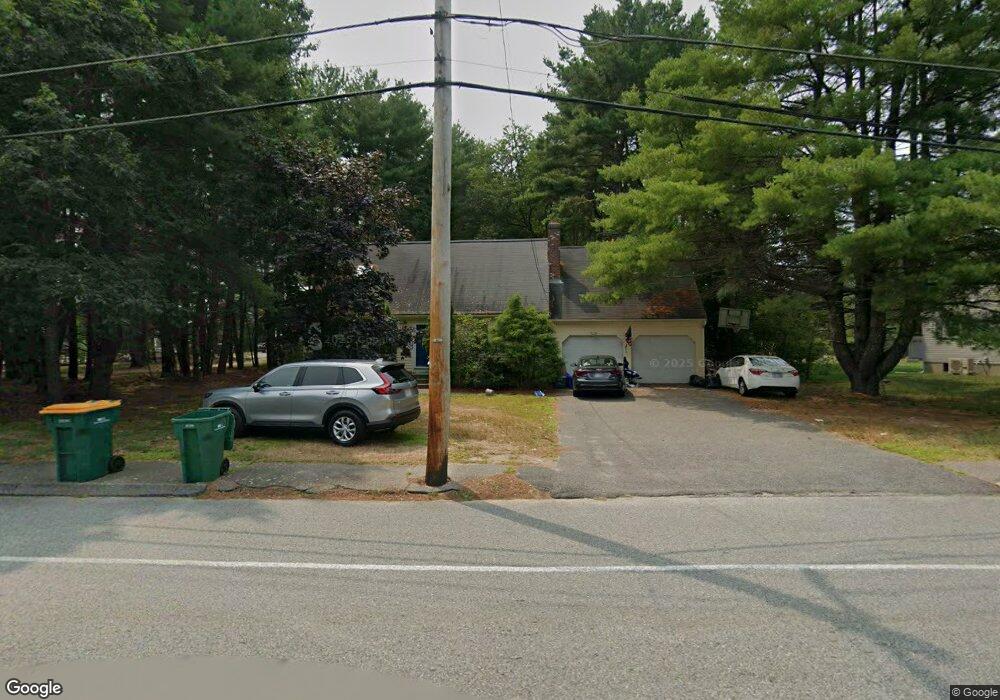
533 Elm St Mansfield, MA 02048
Estimated Value: $707,291 - $733,000
3
Beds
3
Baths
2,010
Sq Ft
$356/Sq Ft
Est. Value
About This Home
This home is located at 533 Elm St, Mansfield, MA 02048 and is currently estimated at $715,823, approximately $356 per square foot. 533 Elm St is a home located in Bristol County with nearby schools including Everett W. Robinson Elementary School, Jordan/Jackson Elementary School, and Harold L. Qualters Middle School.
Ownership History
Date
Name
Owned For
Owner Type
Purchase Details
Closed on
Sep 27, 1993
Sold by
Clifford William S and Clifford Andrea L
Bought by
Roche Joseph M and Roche Joanne D
Current Estimated Value
Home Financials for this Owner
Home Financials are based on the most recent Mortgage that was taken out on this home.
Original Mortgage
$149,150
Interest Rate
7.1%
Mortgage Type
Purchase Money Mortgage
Purchase Details
Closed on
Jun 5, 1992
Sold by
Desvergnes Donald
Bought by
Clifford William S and Clifford Andrea L
Home Financials for this Owner
Home Financials are based on the most recent Mortgage that was taken out on this home.
Original Mortgage
$127,900
Interest Rate
8.8%
Mortgage Type
Purchase Money Mortgage
Create a Home Valuation Report for This Property
The Home Valuation Report is an in-depth analysis detailing your home's value as well as a comparison with similar homes in the area
Home Values in the Area
Average Home Value in this Area
Purchase History
| Date | Buyer | Sale Price | Title Company |
|---|---|---|---|
| Roche Joseph M | $157,000 | -- | |
| Clifford William S | $159,900 | -- |
Source: Public Records
Mortgage History
| Date | Status | Borrower | Loan Amount |
|---|---|---|---|
| Open | Clifford William S | $80,000 | |
| Open | Clifford William S | $154,991 | |
| Closed | Clifford William S | $149,150 | |
| Previous Owner | Clifford William S | $127,900 |
Source: Public Records
Tax History
| Year | Tax Paid | Tax Assessment Tax Assessment Total Assessment is a certain percentage of the fair market value that is determined by local assessors to be the total taxable value of land and additions on the property. | Land | Improvement |
|---|---|---|---|---|
| 2025 | $7,403 | $562,100 | $259,000 | $303,100 |
| 2024 | $7,641 | $566,000 | $259,000 | $307,000 |
| 2023 | $7,562 | $536,700 | $259,000 | $277,700 |
| 2022 | $7,304 | $481,500 | $240,300 | $241,200 |
| 2021 | $4,529 | $460,000 | $209,900 | $250,100 |
| 2020 | $6,626 | $431,400 | $200,100 | $231,300 |
| 2019 | $6,138 | $403,300 | $167,400 | $235,900 |
| 2018 | $4,246 | $389,600 | $160,000 | $229,600 |
| 2017 | $5,469 | $364,100 | $155,700 | $208,400 |
| 2016 | $5,235 | $339,700 | $148,200 | $191,500 |
| 2015 | $5,199 | $335,400 | $148,200 | $187,200 |
Source: Public Records
Map
Nearby Homes
- 2 Oak St Unit 2B
- 44 Surrey Dr
- 451R Gilbert St
- 14 Claire Ave
- 71 Richardson Ave
- 143 Oak St Unit 10
- 150 Gilbert St
- 250 Mansfield Ave Unit 11
- 343 Godfrey Dr
- 101 Godfrey Dr Unit 101
- 85 Jewell St
- 49 Pheasant Hill Rd
- 5 Village Way Unit C
- 10 Anna Way
- 345 Richardson Ave
- 157 Mansfield Ave Unit 27
- 157 Mansfield Ave Unit 14
- 17 Village Way Unit F
- 128 Tremont St
- 19 Barberry Rd
Your Personal Tour Guide
Ask me questions while you tour the home.