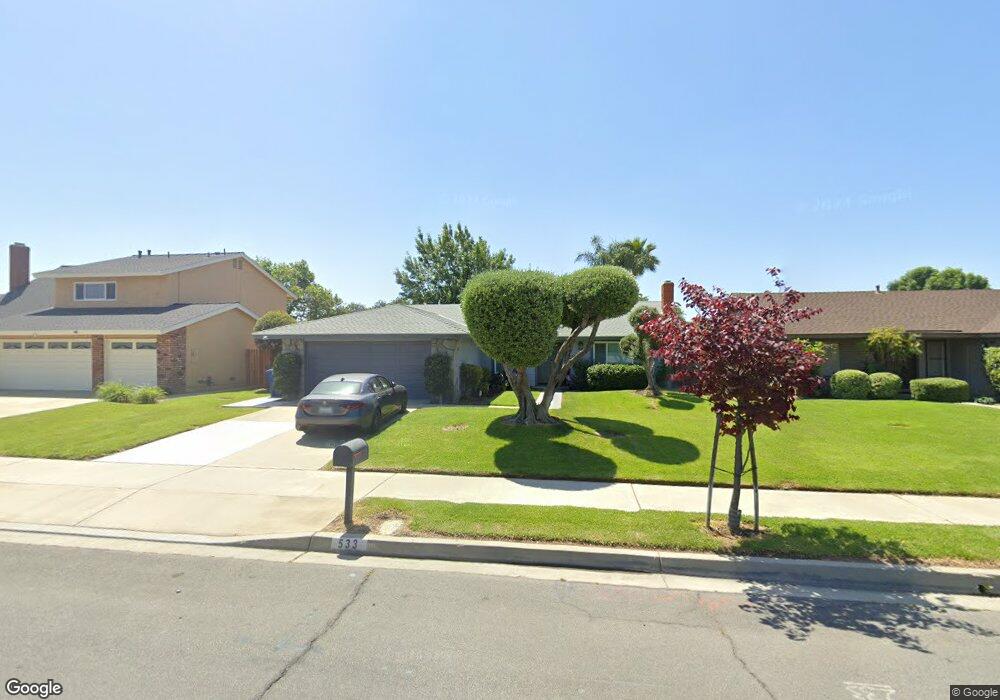
533 Sonoma Ct Ontario, CA 91762
Downtown Ontario NeighborhoodEstimated Value: $727,000 - $877,000
4
Beds
2
Baths
1,872
Sq Ft
$427/Sq Ft
Est. Value
About This Home
This home is located at 533 Sonoma Ct, Ontario, CA 91762 and is currently estimated at $800,086, approximately $427 per square foot. 533 Sonoma Ct is a home located in San Bernardino County with nearby schools including Richard Haynes Elementary, Oaks Middle, and Ontario High School.
Ownership History
Date
Name
Owned For
Owner Type
Purchase Details
Closed on
Mar 28, 2018
Sold by
Federico Marlene
Bought by
Federico Marlene and Federico Living Trust
Current Estimated Value
Purchase Details
Closed on
Jan 25, 2006
Sold by
Wehby Michael
Bought by
Wehby Michael and Federico Ronald
Purchase Details
Closed on
Aug 19, 1998
Sold by
Wehby Michael
Bought by
Wehby Michael and Michael Wehby Living Trust
Create a Home Valuation Report for This Property
The Home Valuation Report is an in-depth analysis detailing your home's value as well as a comparison with similar homes in the area
Home Values in the Area
Average Home Value in this Area
Purchase History
| Date | Buyer | Sale Price | Title Company |
|---|---|---|---|
| Federico Marlene | -- | None Available | |
| Wehby Michael | -- | Accommodation | |
| Wehby Michael | -- | -- |
Source: Public Records
Tax History Compared to Growth
Tax History
| Year | Tax Paid | Tax Assessment Tax Assessment Total Assessment is a certain percentage of the fair market value that is determined by local assessors to be the total taxable value of land and additions on the property. | Land | Improvement |
|---|---|---|---|---|
| 2025 | $2,965 | $275,968 | $96,591 | $179,377 |
| 2024 | $2,965 | $270,557 | $94,697 | $175,860 |
| 2023 | $2,883 | $265,252 | $92,840 | $172,412 |
| 2022 | $2,844 | $260,051 | $91,020 | $169,031 |
| 2021 | $2,825 | $254,952 | $89,235 | $165,717 |
| 2020 | $2,776 | $252,338 | $88,320 | $164,018 |
| 2019 | $2,751 | $247,390 | $86,588 | $160,802 |
| 2018 | $2,713 | $242,539 | $84,890 | $157,649 |
| 2017 | $2,616 | $237,783 | $83,225 | $154,558 |
| 2016 | $2,514 | $233,120 | $81,593 | $151,527 |
| 2015 | $2,497 | $229,618 | $80,367 | $149,251 |
| 2014 | $2,420 | $225,120 | $78,793 | $146,327 |
Source: Public Records
Map
Nearby Homes
- 1546 Redwood Ave
- 559 W Belmont St
- 4251 S Grasly Paseo
- 653 W Belmont St
- 550 W Belmont St
- 1420 S Euclid Ave Unit A & B
- 646 W Belmont St
- 1620 S Cypress Ave
- 754 W Belmont St
- 1214 S Cypress Ave Unit G
- 1216 S Cypress Ave Unit E
- 1849 S San Antonio Ave
- 410 W Maitland St
- 1031 S Palmetto Ave
- 1031 S Palmetto Ave Unit N9
- 1031 S Palmetto Ave Unit W8
- 1031 S Palmetto Ave Unit II3
- 1031 S Palmetto Ave Unit N1
- 1209 S Palmetto Ave Unit C
- 1949 S Palm Place