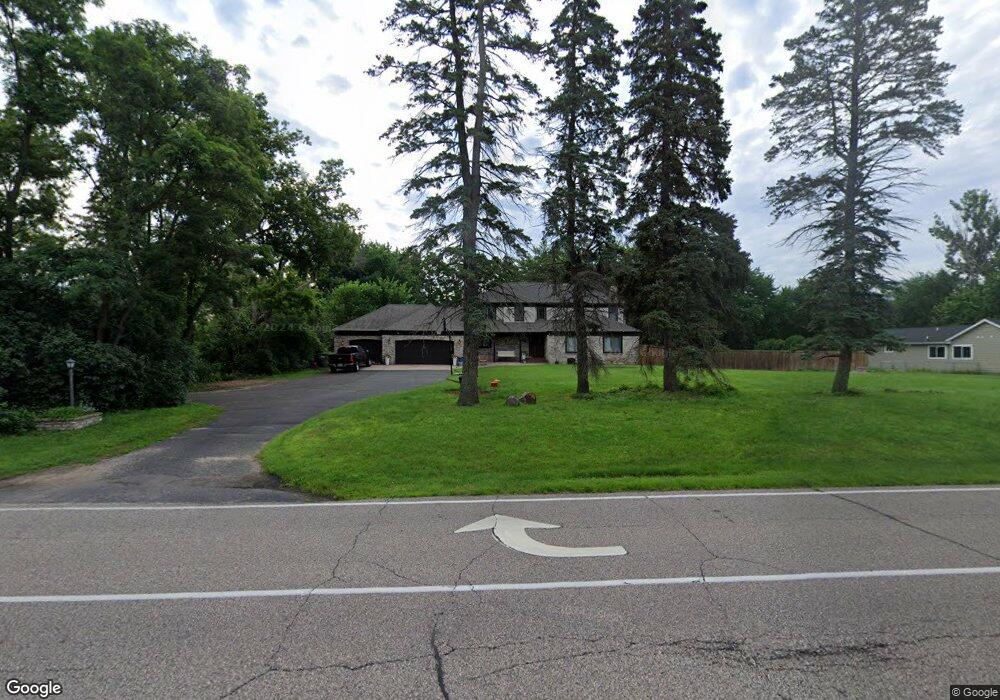
5330 Hodgson Rd Saint Paul, MN 55126
Estimated Value: $721,000 - $873,000
4
Beds
4
Baths
3,302
Sq Ft
$241/Sq Ft
Est. Value
About This Home
This home is located at 5330 Hodgson Rd, Saint Paul, MN 55126 and is currently estimated at $796,084, approximately $241 per square foot. 5330 Hodgson Rd is a home located in Ramsey County with nearby schools including Turtle Lake Elementary School, Chippewa Middle School, and Mounds View Senior High School.
Ownership History
Date
Name
Owned For
Owner Type
Purchase Details
Closed on
Jun 29, 2017
Sold by
Smith Mollie M and Smith James D
Bought by
Fraboni Angelo and Fraboni Megan
Current Estimated Value
Home Financials for this Owner
Home Financials are based on the most recent Mortgage that was taken out on this home.
Original Mortgage
$392,000
Outstanding Balance
$326,133
Interest Rate
3.94%
Estimated Equity
$469,952
Purchase Details
Closed on
Jul 1, 2016
Sold by
Smith James D and Smith Mollie M
Bought by
Smith James D and Smith Mollie M
Home Financials for this Owner
Home Financials are based on the most recent Mortgage that was taken out on this home.
Original Mortgage
$344,250
Interest Rate
3.42%
Purchase Details
Closed on
Jun 7, 2012
Sold by
Matsen Brent and Dahl Rachel Elizabeth
Bought by
Smith Mollie M
Purchase Details
Closed on
Oct 7, 2010
Sold by
Wells Fargo Bank Na
Bought by
Matsen Brent and Matsen Rachel
Purchase Details
Closed on
May 30, 2002
Sold by
Cendant Mobility Co
Bought by
Gorman Kathleen
Create a Home Valuation Report for This Property
The Home Valuation Report is an in-depth analysis detailing your home's value as well as a comparison with similar homes in the area
Home Values in the Area
Average Home Value in this Area
Purchase History
| Date | Buyer | Sale Price | Title Company |
|---|---|---|---|
| Fraboni Angelo | $504,848 | None Available | |
| Smith James D | -- | Title One Inc | |
| Smith Mollie M | $390,000 | -- | |
| Matsen Brent | $255,000 | -- | |
| Gorman Kathleen | $435,000 | -- | |
| Cendant Mobility Co | $435,000 | -- |
Source: Public Records
Mortgage History
| Date | Status | Borrower | Loan Amount |
|---|---|---|---|
| Open | Fraboni Angelo | $392,000 | |
| Previous Owner | Smith James D | $344,250 |
Source: Public Records
Tax History Compared to Growth
Tax History
| Year | Tax Paid | Tax Assessment Tax Assessment Total Assessment is a certain percentage of the fair market value that is determined by local assessors to be the total taxable value of land and additions on the property. | Land | Improvement |
|---|---|---|---|---|
| 2025 | $7,060 | $680,700 | $105,000 | $575,700 |
| 2023 | $7,060 | $621,600 | $150,000 | $471,600 |
| 2022 | $6,022 | $530,500 | $100,000 | $430,500 |
| 2021 | $4,518 | $492,800 | $100,000 | $392,800 |
| 2020 | $4,864 | $376,600 | $80,300 | $296,300 |
| 2019 | $4,546 | $376,600 | $80,300 | $296,300 |
| 2018 | $4,756 | $380,800 | $80,300 | $300,500 |
| 2017 | $5,708 | $387,800 | $80,300 | $307,500 |
| 2016 | $5,960 | $0 | $0 | $0 |
| 2015 | $5,596 | $468,700 | $67,000 | $401,700 |
| 2014 | $5,196 | $0 | $0 | $0 |
Source: Public Records
Map
Nearby Homes
- 5 Anemone Cir Unit 9
- 646 White Birch Dr
- 800 County Road I W
- 670 Birch Ln S
- 5621 Heather Ridge Ct
- 561X Heather Ridge Ct
- 56XX Heather Ridge Ct
- 5680 Donegal Dr
- 5697 Willow Trail
- 5700 Willow Trail
- 5721 Hodgson Rd
- 5245 Oxford St N
- 549 Vicki Ln
- 5282 W Lake Beach Ct
- 5699 Fawn Ln
- 4825 Hodgson Connection
- 4839 Larson Rd
- 5657 Chatsworth St N
- 5815 Turtle Lake Rd
- 17 S Long Lake Trail
- 5330 5330 Hodgson-Road-
- 5320 5320 Hodgson-Road-
- 5320 Hodgson Rd
- 50 Wildflower Way
- 50 50 Wildflower Way
- 88 Wildflower Place
- 9 9 Charley Lake-Court-
- 7 Charley Lake Ct
- 9 Charley Lake Ct
- 9 Charley Lake Ct
- 5 Charley Lake Ct
- 3 Anemone Cir
- 1 Anemone Cir
- 7 Anemone Cir
- 5 Charley Lake Ct
- 8 Anemone Cir
- 77 Wildflower Place
- 3 Charley Lake Ct
- 10 Anemone Cir
- 638 White Birch Dr