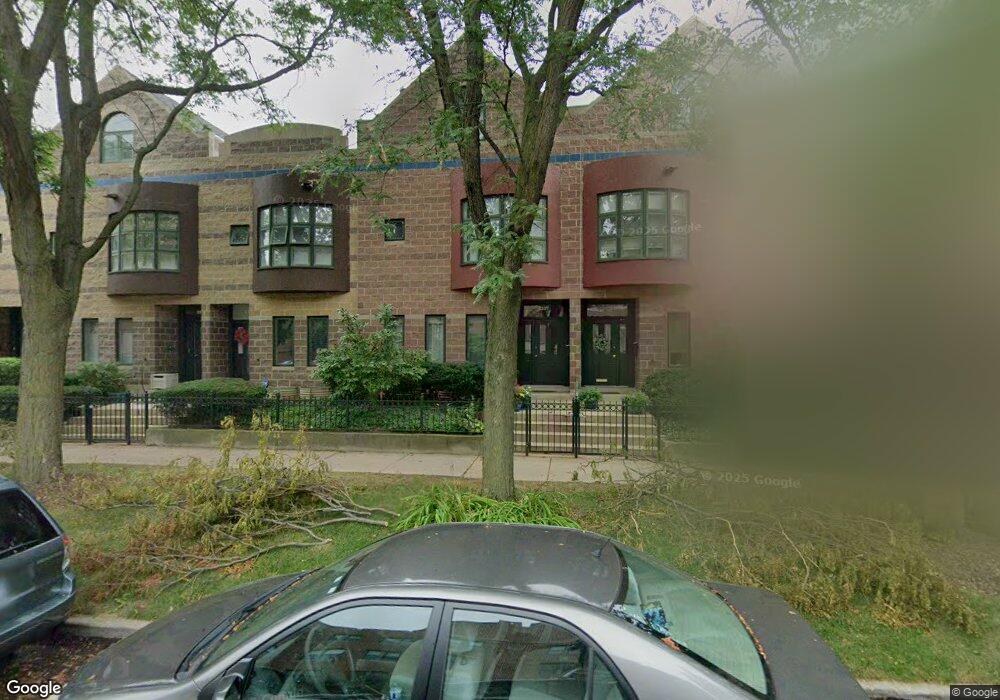
5331 S Drexel Ave Chicago, IL 60615
Hyde Park NeighborhoodEstimated Value: $498,000 - $626,689
4
Beds
4
Baths
2,500
Sq Ft
$226/Sq Ft
Est. Value
About This Home
This home is located at 5331 S Drexel Ave, Chicago, IL 60615 and is currently estimated at $566,172, approximately $226 per square foot. 5331 S Drexel Ave is a home located in Cook County with nearby schools including Kozminski Community Academy, Kenwood Academy High School, and St. Thomas the Apostle Elementary School.
Ownership History
Date
Name
Owned For
Owner Type
Purchase Details
Closed on
Oct 6, 2010
Sold by
Donner Elvira P and Pellitteri Elvira
Bought by
Pellitteri Elvira
Current Estimated Value
Home Financials for this Owner
Home Financials are based on the most recent Mortgage that was taken out on this home.
Original Mortgage
$180,000
Interest Rate
4.3%
Mortgage Type
New Conventional
Purchase Details
Closed on
Oct 10, 2003
Sold by
Snapp Kevin E and Snapp Susan J
Bought by
Donner Elvira P
Home Financials for this Owner
Home Financials are based on the most recent Mortgage that was taken out on this home.
Original Mortgage
$200,000
Interest Rate
6.23%
Mortgage Type
Unknown
Purchase Details
Closed on
Jul 13, 1999
Sold by
Rimes Martin W
Bought by
Snapp Kevin E and Snapp Susan J
Purchase Details
Closed on
May 5, 1995
Sold by
Roy Raymond J and Rimes Martin W
Bought by
Rimes Martin W
Create a Home Valuation Report for This Property
The Home Valuation Report is an in-depth analysis detailing your home's value as well as a comparison with similar homes in the area
Home Values in the Area
Average Home Value in this Area
Purchase History
| Date | Buyer | Sale Price | Title Company |
|---|---|---|---|
| Pellitteri Elvira | -- | Multiple | |
| Donner Elvira P | $395,000 | 1St American Title | |
| Snapp Kevin E | $300,000 | Burnet Title Llc | |
| Rimes Martin W | $25,000 | -- |
Source: Public Records
Mortgage History
| Date | Status | Borrower | Loan Amount |
|---|---|---|---|
| Closed | Pellitteri Elvira | $180,000 | |
| Closed | Donner Elvira P | $200,000 |
Source: Public Records
Tax History
| Year | Tax Paid | Tax Assessment Tax Assessment Total Assessment is a certain percentage of the fair market value that is determined by local assessors to be the total taxable value of land and additions on the property. | Land | Improvement |
|---|---|---|---|---|
| 2025 | $8,053 | $49,000 | $14,192 | $34,808 |
| 2024 | $8,053 | $49,000 | $14,192 | $34,808 |
| 2023 | $7,784 | $44,000 | $11,445 | $32,555 |
| 2022 | $7,784 | $44,000 | $11,445 | $32,555 |
| 2021 | $7,643 | $44,000 | $11,445 | $32,555 |
| 2020 | $6,839 | $36,284 | $9,156 | $27,128 |
| 2019 | $6,684 | $39,440 | $9,156 | $30,284 |
| 2018 | $6,569 | $39,440 | $9,156 | $30,284 |
| 2017 | $6,616 | $36,811 | $7,553 | $29,258 |
| 2016 | $6,515 | $36,811 | $7,553 | $29,258 |
| 2015 | $5,921 | $36,811 | $7,553 | $29,258 |
| 2014 | $5,475 | $33,910 | $6,180 | $27,730 |
| 2013 | $5,348 | $33,910 | $6,180 | $27,730 |
Source: Public Records
Map
Nearby Homes
- 5404 S Drexel Ave
- 5401 S Maryland Ave
- 5430 S Drexel Ave
- 5471 S Ingleside Ave Unit 1E
- 5340 S Greenwood Ave Unit 1
- 5342 S Greenwood Ave Unit 3
- 843 E 52nd St Unit 1
- 840 E 52nd St Unit 1E
- 838 E 52nd St Unit 1W
- 836 E 52nd St
- 5200 S Ellis Ave Unit 202
- 5309 S Greenwood Ave
- 823 E Drexel Square
- 825 E Drexel Square Unit 2
- 5230 S University Ave Unit D
- 951 E Hyde Park Blvd
- 4730 S Drexel Ave Unit 3N
- 945 E Hyde Park Blvd Unit 2
- 222-226 E 56th St
- 5424 S Ingleside Ave
- 5333 S Drexel Ave
- 5335 S Drexel Ave
- 5337 S Drexel Ave
- 5329 S Drexel Ave
- 5339 S Drexel Ave
- 5327 S Drexel Ave
- 5327 S Drexel Ave Unit 1
- 5327 S Drexel Blvd Unit 1
- 5341 S Drexel Ave
- 5325 S Drexel Ave
- 5323 S Drexel Ave
- 5332 S Ingleside Ave
- 5330 S Ingleside Ave
- 5334 S Ingleside Ave
- 5336 S Ingleside Ave
- 5328 S Ingleside Ave
- 5321 S Drexel Ave
- 902 E 54th St
- 906 E 54th St
- 5326 S Ingleside Ave
Your Personal Tour Guide
Ask me questions while you tour the home.