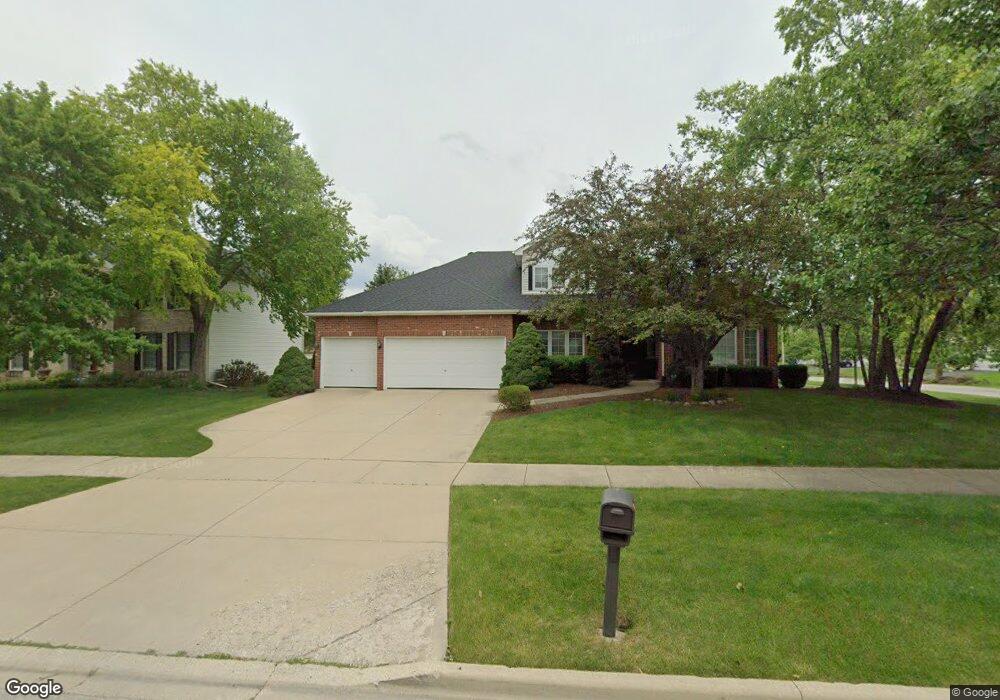
5336 Switch Grass Ln Naperville, IL 60564
High Meadow NeighborhoodEstimated Value: $566,000 - $700,000
4
Beds
3
Baths
2,498
Sq Ft
$265/Sq Ft
Est. Value
About This Home
This home is located at 5336 Switch Grass Ln, Naperville, IL 60564 and is currently estimated at $660,829, approximately $264 per square foot. 5336 Switch Grass Ln is a home located in Will County with nearby schools including Graham Elementary School, Clifford Crone Middle School, and Neuqua Valley High School.
Ownership History
Date
Name
Owned For
Owner Type
Purchase Details
Closed on
May 23, 2017
Sold by
Hammond Susan J and Mcdonnell Declarati Margaret J
Bought by
Hatter Jamero J and Hyatt Fatina M
Current Estimated Value
Home Financials for this Owner
Home Financials are based on the most recent Mortgage that was taken out on this home.
Original Mortgage
$408,500
Outstanding Balance
$338,688
Interest Rate
3.99%
Mortgage Type
New Conventional
Estimated Equity
$322,141
Purchase Details
Closed on
Nov 29, 2005
Sold by
Mcdonnell Margaret J
Bought by
Mcdonnell Margaret J and Mcdonnell Declarati Margaret J
Purchase Details
Closed on
Apr 21, 1998
Sold by
Robert Kettell Construction Corp
Bought by
Mcdonnell Margaret J
Purchase Details
Closed on
Apr 20, 1998
Sold by
Harris Bank Naperville
Bought by
Claybridge Builders Inc
Create a Home Valuation Report for This Property
The Home Valuation Report is an in-depth analysis detailing your home's value as well as a comparison with similar homes in the area
Home Values in the Area
Average Home Value in this Area
Purchase History
| Date | Buyer | Sale Price | Title Company |
|---|---|---|---|
| Hatter Jamero J | $430,000 | Chicago Title Insurance Co | |
| Mcdonnell Margaret J | -- | None Available | |
| Mcdonnell Margaret J | -- | -- | |
| Robert Kettell Construction Corp | $88,000 | -- | |
| Claybridge Builders Inc | $62,000 | -- |
Source: Public Records
Mortgage History
| Date | Status | Borrower | Loan Amount |
|---|---|---|---|
| Open | Hatter Jamero J | $408,500 |
Source: Public Records
Tax History
| Year | Tax Paid | Tax Assessment Tax Assessment Total Assessment is a certain percentage of the fair market value that is determined by local assessors to be the total taxable value of land and additions on the property. | Land | Improvement |
|---|---|---|---|---|
| 2024 | $11,902 | $189,712 | $52,673 | $137,039 |
| 2023 | $11,902 | $167,590 | $46,531 | $121,059 |
| 2022 | $10,691 | $158,559 | $44,017 | $114,542 |
| 2021 | $10,198 | $151,009 | $41,921 | $109,088 |
| 2020 | $9,998 | $148,617 | $41,257 | $107,360 |
| 2019 | $9,815 | $144,428 | $40,094 | $104,334 |
| 2018 | $9,789 | $141,672 | $39,212 | $102,460 |
| 2017 | $9,628 | $138,015 | $38,200 | $99,815 |
| 2016 | $9,600 | $135,044 | $37,378 | $97,666 |
| 2015 | -- | $129,850 | $35,940 | $93,910 |
| 2014 | -- | $127,919 | $35,940 | $91,979 |
| 2013 | -- | $127,919 | $35,940 | $91,979 |
Source: Public Records
Map
Nearby Homes
- 2511 Wild Timothy Rd
- 5719 Rosinweed Ln
- 2419 Lawlor Ln
- 2519 Mallet Ct
- 2543 Mallet Ct
- 2423 Lawlor Ln
- 2547 Mallet Ct
- 2515 Mallet Ct
- 2427 Lawlor Ln
- 2607 Lawlor Ln
- 2611 Lawlor Ln
- 2512 Lawlor Ln
- 2516 Lawlor Ln
- 2316 Spur Rd
- 2539 Tailshot Rd
- 2547 Tailshot Rd
- 5902 Hawkweed Dr Unit 7401
- 5904 Hawkweed Dr Unit 7402
- 5907 Polo St
- 2317 Horseshoe Cir Unit 10202
- 5332 Switch Grass Ln
- 5335 Papaw Dr
- 5331 Papaw Dr
- 5328 Switch Grass Ln
- 2412 Wild Timothy Rd
- 2503 Wild Timothy Rd
- 2408 Wild Timothy Rd
- 5327 Papaw Dr
- 2404 Wild Timothy Rd
- 5331 Switch Grass Ln
- 2504 Wild Timothy Rd
- 2507 Wild Timothy Rd
- 5323 Papaw Dr
- 2336 Wild Timothy Rd
- 5327 Switch Grass Ln Unit 8
- 6035 Rosinweed Ln
- 6031 Rosinweed Ln Unit 2
- 5320 Switch Grass Ln
- 5336 Papaw Dr Unit 8
- 2508 Wild Timothy Rd
Your Personal Tour Guide
Ask me questions while you tour the home.