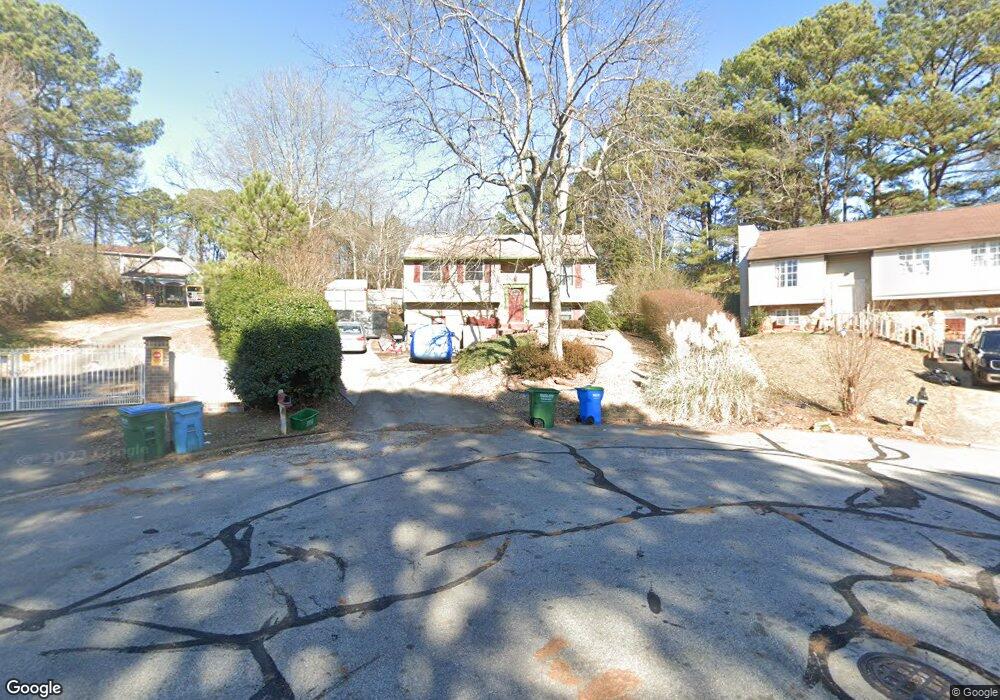
5337 Weslock Ct Norcross, GA 30093
Estimated Value: $295,000 - $369,000
4
Beds
3
Baths
1,572
Sq Ft
$216/Sq Ft
Est. Value
About This Home
This home is located at 5337 Weslock Ct, Norcross, GA 30093 and is currently estimated at $339,437, approximately $215 per square foot. 5337 Weslock Ct is a home located in Gwinnett County with nearby schools including Lilburn Elementary School, Lilburn Middle School, and Meadowcreek High School.
Ownership History
Date
Name
Owned For
Owner Type
Purchase Details
Closed on
Aug 11, 2011
Sold by
Nwankwo Peace
Bought by
Akamihe Maureen Onyinyechi
Current Estimated Value
Purchase Details
Closed on
Oct 5, 2010
Sold by
Wells Fargo Bk Na
Bought by
Hud-Housing Of Urban Dev
Purchase Details
Closed on
Jun 9, 2006
Sold by
Vasquez Alejandro
Bought by
Bonilla Carlos and Bonilla Rosa I
Home Financials for this Owner
Home Financials are based on the most recent Mortgage that was taken out on this home.
Original Mortgage
$150,064
Interest Rate
6.6%
Mortgage Type
FHA
Purchase Details
Closed on
Apr 3, 1995
Sold by
Martinez Hilarion
Bought by
Vasquez Alejandro
Purchase Details
Closed on
Jul 22, 1994
Sold by
Garcia Luis H Regina
Bought by
Martinez Hilarion
Home Financials for this Owner
Home Financials are based on the most recent Mortgage that was taken out on this home.
Original Mortgage
$64,600
Interest Rate
10.5%
Mortgage Type
VA
Create a Home Valuation Report for This Property
The Home Valuation Report is an in-depth analysis detailing your home's value as well as a comparison with similar homes in the area
Home Values in the Area
Average Home Value in this Area
Purchase History
| Date | Buyer | Sale Price | Title Company |
|---|---|---|---|
| Akamihe Maureen Onyinyechi | $37,000 | -- | |
| Nwankwo Peace | $37,000 | -- | |
| Hud-Housing Of Urban Dev | -- | -- | |
| Wells Fargo Bk Na | $153,555 | -- | |
| Bonilla Carlos | $152,500 | -- | |
| Vasquez Alejandro | $14,800 | -- | |
| Martinez Hilarion | $10,000 | -- |
Source: Public Records
Mortgage History
| Date | Status | Borrower | Loan Amount |
|---|---|---|---|
| Previous Owner | Bonilla Carlos | $150,064 | |
| Previous Owner | Martinez Hilarion | $64,600 | |
| Closed | Vasquez Alejandro | $0 |
Source: Public Records
Tax History
| Year | Tax Paid | Tax Assessment Tax Assessment Total Assessment is a certain percentage of the fair market value that is determined by local assessors to be the total taxable value of land and additions on the property. | Land | Improvement |
|---|---|---|---|---|
| 2025 | $2,998 | $120,960 | $21,120 | $99,840 |
| 2024 | $2,996 | $115,080 | $21,120 | $93,960 |
| 2023 | $2,996 | $103,520 | $23,200 | $80,320 |
| 2022 | $2,446 | $90,680 | $14,400 | $76,280 |
| 2021 | $1,955 | $65,680 | $14,400 | $51,280 |
| 2020 | $469 | $65,680 | $14,400 | $51,280 |
| 2019 | $1,511 | $54,240 | $11,200 | $43,040 |
| 2018 | $1,683 | $54,240 | $11,200 | $43,040 |
| 2016 | $1,424 | $41,920 | $8,800 | $33,120 |
| 2015 | $1,220 | $32,120 | $6,400 | $25,720 |
| 2014 | $1,225 | $32,120 | $6,400 | $25,720 |
Source: Public Records
Map
Nearby Homes
- 1317 Country Downs Dr
- 1133 Sandune Dr
- 5345 Seattle Slew Ct Unit 3
- 5395 Kings Ridge Place
- 5271 Williams Rd Unit A-1
- 1193 Greenyard Way Unit 3
- 1413 Silver Lake Dr
- 5554 Clover Rise Ln Unit 2
- 5331 Sherwin Dr
- 5323 Sherwin Dr
- 1318 Hoy Taylor Dr Unit 1
- 1338 Hoy Taylor Dr Unit 1
- 5605 Rock Place Ct
- 1437 Roman Point Dr
- 956 Six Oaks Cir Unit B
- 1572 Kings Ridge Dr Unit 3
- 5341 Woodbin Dr
- 5675 Terremont Cir
- 5053 Audubon Place Unit 4
- 0 Harbins Rd NW Unit 7598091
- 5327 Weslock Ct
- 5347 Weslock Ct
- 5317 Weslock Ct Unit 4
- 5357 Weslock Ct
- 5341 Weslock Ct
- 5151 Williams Rd
- 5141 Williams Rd
- 5306 Weslock Ct Unit 1
- 5307 Weslock Ct
- 5161 Williams Rd
- 5131 Williams Rd Unit 3
- 5131 Williams Rd
- 5356 Weslock Ct Unit 4
- 1243 Sandune Dr
- 1253 Sandune Dr Unit 4
- 5297 Weslock Ct Unit 5
- 5296 Weslock Ct
- 5296 Weslock Ct
- 5171 Williams Rd
- 1263 Sandune Dr