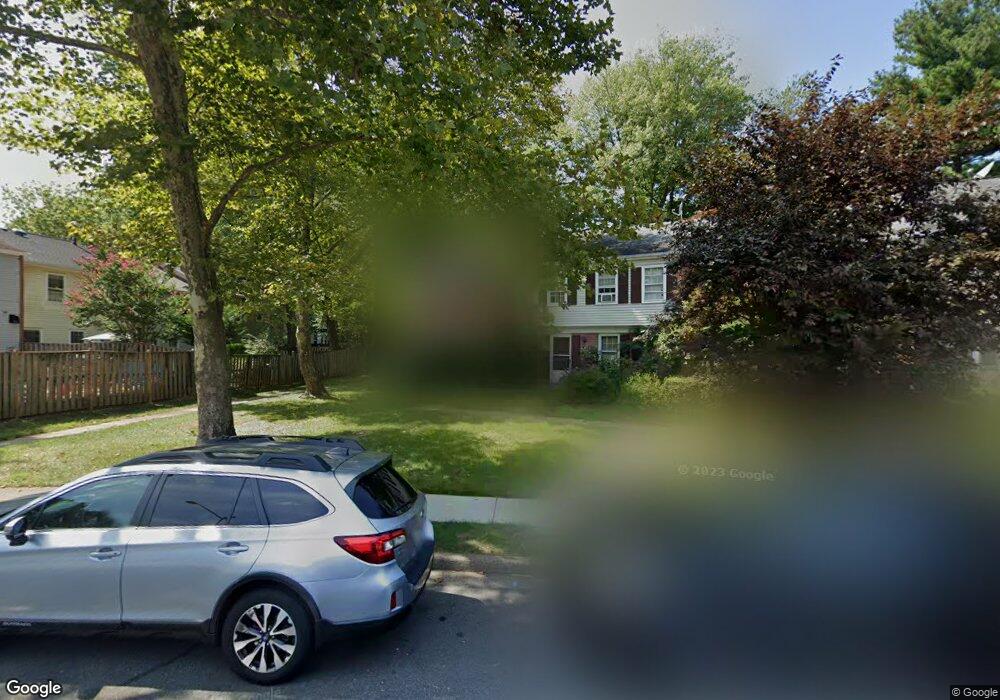
5340 Danbury Forest Dr Springfield, VA 22151
Estimated Value: $571,868 - $610,000
3
Beds
3
Baths
1,232
Sq Ft
$481/Sq Ft
Est. Value
About This Home
This home is located at 5340 Danbury Forest Dr, Springfield, VA 22151 and is currently estimated at $592,717, approximately $481 per square foot. 5340 Danbury Forest Dr is a home located in Fairfax County with nearby schools including Kings Park Elementary School, Kings Glen Elementary School, and Lake Braddock Secondary School.
Ownership History
Date
Name
Owned For
Owner Type
Purchase Details
Closed on
Nov 30, 2011
Sold by
Fox Real Estate Llc
Bought by
Mcgovern Justin
Current Estimated Value
Purchase Details
Closed on
Aug 25, 2011
Sold by
Federal Home Loan Mortgage Corporation
Bought by
Fox Real Estate Llc
Purchase Details
Closed on
Mar 7, 2011
Sold by
Professional Foreclosure Corp
Bought by
Federal Home Loan Mortgage Corporation
Purchase Details
Closed on
Feb 28, 2007
Sold by
Hoffman Carole P
Bought by
Manzilla Noelia
Home Financials for this Owner
Home Financials are based on the most recent Mortgage that was taken out on this home.
Original Mortgage
$300,000
Interest Rate
6.27%
Mortgage Type
New Conventional
Purchase Details
Closed on
Aug 21, 2000
Sold by
Nutt Dennis J
Bought by
Hofman Carole P
Home Financials for this Owner
Home Financials are based on the most recent Mortgage that was taken out on this home.
Original Mortgage
$82,900
Interest Rate
8.06%
Create a Home Valuation Report for This Property
The Home Valuation Report is an in-depth analysis detailing your home's value as well as a comparison with similar homes in the area
Home Values in the Area
Average Home Value in this Area
Purchase History
| Date | Buyer | Sale Price | Title Company |
|---|---|---|---|
| Mcgovern Justin | $324,000 | -- | |
| Fox Real Estate Llc | $274,000 | -- | |
| Federal Home Loan Mortgage Corporation | $270,488 | -- | |
| Manzilla Noelia | $375,000 | -- | |
| Hofman Carole P | $164,900 | -- |
Source: Public Records
Mortgage History
| Date | Status | Borrower | Loan Amount |
|---|---|---|---|
| Previous Owner | Manzilla Noelia | $300,000 | |
| Previous Owner | Hofman Carole P | $82,900 |
Source: Public Records
Tax History Compared to Growth
Tax History
| Year | Tax Paid | Tax Assessment Tax Assessment Total Assessment is a certain percentage of the fair market value that is determined by local assessors to be the total taxable value of land and additions on the property. | Land | Improvement |
|---|---|---|---|---|
| 2025 | $6,510 | $597,630 | $195,000 | $402,630 |
| 2024 | $6,510 | $561,970 | $165,000 | $396,970 |
| 2023 | $5,840 | $517,480 | $165,000 | $352,480 |
| 2022 | $5,431 | $474,960 | $155,000 | $319,960 |
| 2021 | $4,962 | $422,870 | $130,000 | $292,870 |
| 2020 | $4,806 | $406,080 | $130,000 | $276,080 |
| 2019 | $4,747 | $401,080 | $125,000 | $276,080 |
| 2018 | $4,433 | $385,460 | $120,000 | $265,460 |
| 2017 | $4,475 | $385,460 | $120,000 | $265,460 |
| 2016 | $4,391 | $379,020 | $120,000 | $259,020 |
| 2015 | $4,230 | $379,020 | $120,000 | $259,020 |
| 2014 | $3,888 | $349,190 | $115,000 | $234,190 |
Source: Public Records
Map
Nearby Homes
- 8449 Thames St
- 8441 Thames St
- 8405 Thames St
- 5511 Callander Dr
- 8504 Canterbury Dr
- 5809 Royal Ridge Dr Unit I
- 5778 Rexford Ct Unit 5778B
- 5823 Royal Ridge Dr Unit S
- 5800 Torington Dr Unit 836
- 8616 Canterbury Dr
- 8519 Westover Ct Unit 763
- 5105 Overlook Park
- 8530 Barrington Ct Unit 938
- 5816 Torington Dr Unit 860
- 5824 Rexford Dr Unit 731
- 8322 Highcliffe Ct
- 0 Lower Cranberry Lake Unit 1624408
- 5639 Fort Corloran Dr
- 8344 Darlington St Unit 486
- 8437 Forrester Blvd
- 5338 Danbury Forest Dr
- 5336 Danbury Forest Dr
- 5404 Donnelly Ct
- 5334 Danbury Forest Dr
- 5406 Donnelly Ct
- 5402 Donnelly Ct
- 5408 Donnelly Ct
- 5400 Donnelly Ct
- 5410 Donnelly Ct
- 5412 Donnelly Ct
- 5414 Donnelly Ct
- 5332 Danbury Forest Dr
- 5416 Donnelly Ct
- 5411 Donnelly Ct
- 5330 Danbury Forest Dr
- 5418 Donnelly Ct
- 5413 Donnelly Ct
- 5328 Danbury Forest Dr
- 5415 Donnelly Ct
- 5420 Donnelly Ct