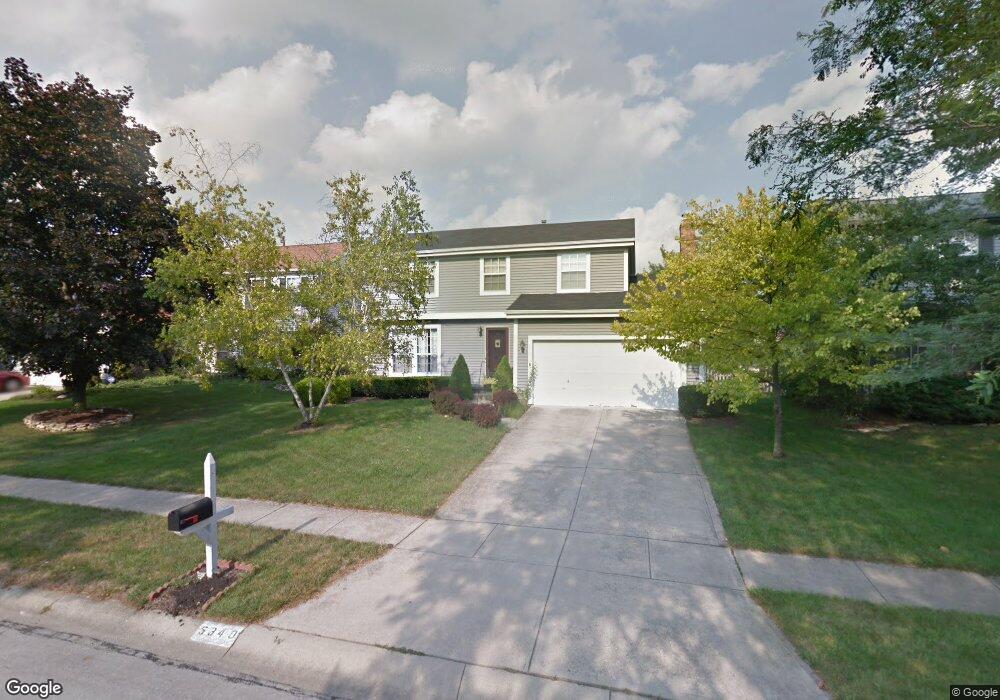
5340 Thistledown Dr Columbus, OH 43221
Dexter Falls NeighborhoodEstimated Value: $406,000 - $458,000
4
Beds
3
Baths
1,796
Sq Ft
$237/Sq Ft
Est. Value
About This Home
This home is located at 5340 Thistledown Dr, Columbus, OH 43221 and is currently estimated at $424,904, approximately $236 per square foot. 5340 Thistledown Dr is a home located in Franklin County with nearby schools including Britton Elementary School, Hilliard Tharp Sixth Grade Elementary School, and Hilliard Weaver Middle School.
Ownership History
Date
Name
Owned For
Owner Type
Purchase Details
Closed on
Apr 30, 2019
Sold by
Kuehn James Scott and Kuehn Tanya R
Bought by
Kuehn James Scott and Kuehn Tanya R
Current Estimated Value
Purchase Details
Closed on
Aug 22, 2003
Sold by
Yoder Jonathan L and Yoder Tammy S
Bought by
Kuehn James Scott and Kurhn Tanya R
Purchase Details
Closed on
Jul 30, 1998
Sold by
Bailey Joseph P
Bought by
Yoder Jonathan L and Yoder Tammy S
Purchase Details
Closed on
Jun 1, 1995
Sold by
Lutz Dana M
Bought by
Joseph P Bailey
Home Financials for this Owner
Home Financials are based on the most recent Mortgage that was taken out on this home.
Original Mortgage
$124,338
Interest Rate
8.26%
Mortgage Type
VA
Purchase Details
Closed on
Aug 2, 1989
Create a Home Valuation Report for This Property
The Home Valuation Report is an in-depth analysis detailing your home's value as well as a comparison with similar homes in the area
Home Values in the Area
Average Home Value in this Area
Purchase History
| Date | Buyer | Sale Price | Title Company |
|---|---|---|---|
| Kuehn James Scott | -- | None Available | |
| Kuehn James Scott | $179,900 | Chicago Title | |
| Yoder Jonathan L | $130,000 | Franklin Abstract | |
| Joseph P Bailey | $121,900 | -- | |
| -- | $94,000 | -- |
Source: Public Records
Mortgage History
| Date | Status | Borrower | Loan Amount |
|---|---|---|---|
| Previous Owner | Joseph P Bailey | $124,338 |
Source: Public Records
Tax History Compared to Growth
Tax History
| Year | Tax Paid | Tax Assessment Tax Assessment Total Assessment is a certain percentage of the fair market value that is determined by local assessors to be the total taxable value of land and additions on the property. | Land | Improvement |
|---|---|---|---|---|
| 2024 | $6,810 | $120,580 | $42,000 | $78,580 |
| 2023 | $5,900 | $120,580 | $42,000 | $78,580 |
| 2022 | $4,862 | $79,560 | $25,200 | $54,360 |
| 2021 | $4,857 | $79,560 | $25,200 | $54,360 |
| 2020 | $4,843 | $79,560 | $25,200 | $54,360 |
| 2019 | $4,756 | $66,710 | $21,000 | $45,710 |
| 2018 | $4,669 | $66,710 | $21,000 | $45,710 |
| 2017 | $4,822 | $66,710 | $21,000 | $45,710 |
| 2016 | $4,909 | $64,050 | $15,890 | $48,160 |
| 2015 | $4,601 | $64,050 | $15,890 | $48,160 |
| 2014 | $4,610 | $64,050 | $15,890 | $48,160 |
| 2013 | $2,223 | $60,970 | $15,120 | $45,850 |
Source: Public Records
Map
Nearby Homes
- 3660 Rivervail Dr
- 5500 Saddlebrook Dr
- 3761 Carnforth Dr
- 3552 Mountshannon Rd
- 3873 Tweedsmuir Dr
- 5500 Shannon Heights Blvd
- 3741 Baybridge Ln
- 5506 Shannon Heights Blvd
- 3894 Maidens Larne Dr
- 5049 Dinard Way
- 3940 Rennes Dr
- 4898 Davidson Run Dr
- 3873 Oakbridge Ln Unit 262
- 3119 Rivermill Dr Unit 24
- 5735 Newbank Cir Unit 303
- 3158 Kingsmead Trace Unit 3158
- 4044 Dumfries Ct
- 5753 Newgate Rd Unit 5753
- 4664 Cutwater Ln
- 5657 Barry Trace
- 5348 Thistledown Dr
- 5332 Thistledown Dr
- 3660 Seattle Slew Dr
- 3652 Seattle Slew Dr
- 5356 Thistledown Dr
- 5324 Thistledown Dr
- 3668 Seattle Slew Dr
- 3699 Fox Hunt Trail
- 3644 Seattle Slew Dr
- 5364 Thistledown Dr
- 3636 Seattle Slew Dr
- 3692 Seattle Slew Dr
- 3707 Fox Hunt Trail
- 3700 Fox Hunt Trail
- 3628 Seattle Slew Dr
- 3700 Seattle Slew Dr
- 3677 Seattle Slew Dr
- 3708 Fox Hunt Trail
- 3685 Seattle Slew Dr
- 3715 Fox Hunt Trail