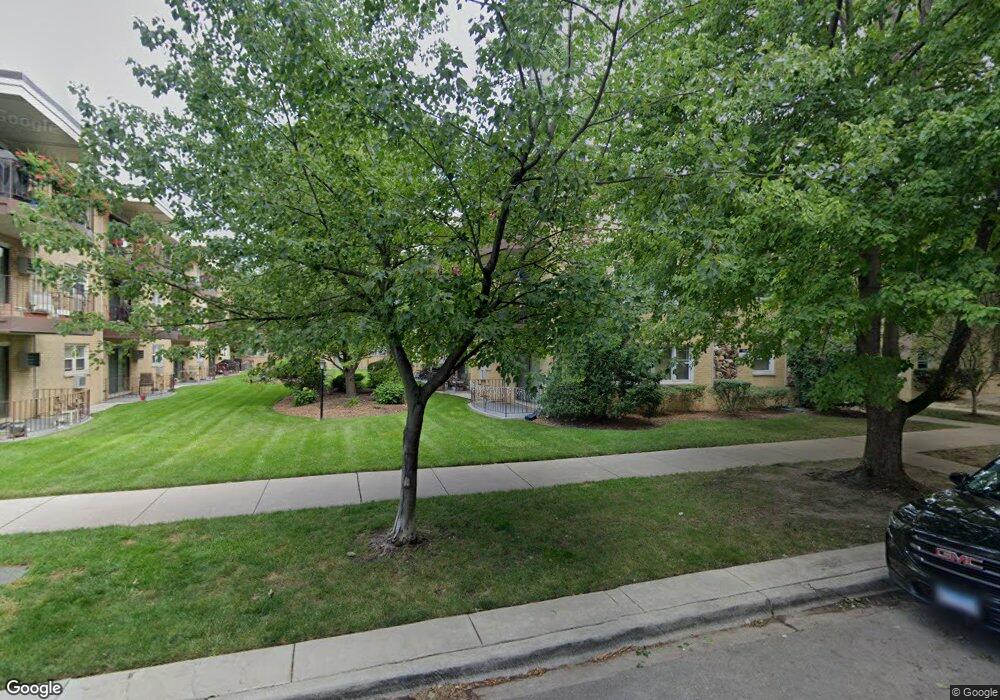
5340 W Windsor Ave Unit 1D Chicago, IL 60630
Jefferson Park NeighborhoodEstimated Value: $175,000 - $236,000
--
Bed
--
Bath
--
Sq Ft
0.85
Acres
About This Home
This home is located at 5340 W Windsor Ave Unit 1D, Chicago, IL 60630 and is currently estimated at $217,700. 5340 W Windsor Ave Unit 1D is a home located in Cook County with nearby schools including Portage Park Elementary School, Schurz High School, and St John Lutheran School.
Ownership History
Date
Name
Owned For
Owner Type
Purchase Details
Closed on
May 22, 2012
Sold by
Federal Home Loan Mortgage Corporation
Bought by
Dema Vladimir
Current Estimated Value
Purchase Details
Closed on
Jan 11, 2012
Sold by
Parado Danilo P
Bought by
Federal Home Loan Mortgage Corporation
Purchase Details
Closed on
Oct 25, 2002
Sold by
Umutia Rosa
Bought by
Parado Danilo and Parado Inocenta
Home Financials for this Owner
Home Financials are based on the most recent Mortgage that was taken out on this home.
Original Mortgage
$167,810
Interest Rate
5.78%
Mortgage Type
Unknown
Purchase Details
Closed on
Aug 29, 2002
Sold by
Urrutia Edwin E and Urrutia Rosa
Bought by
Urrutia Rosa
Home Financials for this Owner
Home Financials are based on the most recent Mortgage that was taken out on this home.
Original Mortgage
$167,810
Interest Rate
5.78%
Mortgage Type
Unknown
Create a Home Valuation Report for This Property
The Home Valuation Report is an in-depth analysis detailing your home's value as well as a comparison with similar homes in the area
Home Values in the Area
Average Home Value in this Area
Purchase History
| Date | Buyer | Sale Price | Title Company |
|---|---|---|---|
| Dema Vladimir | $75,000 | Attorneys Title Guaranty Fun | |
| Federal Home Loan Mortgage Corporation | -- | Attorneys Title Guaranty Fun | |
| Parado Danilo | $173,000 | -- | |
| Parado Danilo | $173,000 | -- | |
| Urrutia Rosa | -- | -- |
Source: Public Records
Mortgage History
| Date | Status | Borrower | Loan Amount |
|---|---|---|---|
| Previous Owner | Parado Danilo | $167,810 |
Source: Public Records
Tax History Compared to Growth
Tax History
| Year | Tax Paid | Tax Assessment Tax Assessment Total Assessment is a certain percentage of the fair market value that is determined by local assessors to be the total taxable value of land and additions on the property. | Land | Improvement |
|---|---|---|---|---|
| 2024 | $2,678 | $19,709 | $3,860 | $15,849 |
| 2023 | $2,589 | $16,000 | $3,088 | $12,912 |
| 2022 | $2,589 | $16,000 | $3,088 | $12,912 |
| 2021 | $2,549 | $15,999 | $3,087 | $12,912 |
| 2020 | $2,117 | $12,601 | $1,599 | $11,002 |
| 2019 | $2,140 | $14,075 | $1,599 | $12,476 |
| 2018 | $2,103 | $14,075 | $1,599 | $12,476 |
| 2017 | $2,487 | $14,920 | $1,433 | $13,487 |
| 2016 | $2,490 | $14,920 | $1,433 | $13,487 |
| 2015 | $2,255 | $14,920 | $1,433 | $13,487 |
| 2014 | $1,785 | $12,182 | $1,323 | $10,859 |
| 2013 | $1,739 | $12,182 | $1,323 | $10,859 |
Source: Public Records
Map
Nearby Homes
- 5330 W Windsor Ave Unit 3I
- 5352 W Sunnyside Ave
- 5416 W Windsor Ave Unit 1N
- 5516 W Windsor Ave Unit 2M
- 5354 W Montrose Ave
- 5401 W Montrose Ave
- 4501 N Central Ave Unit 301
- 4656 N Leamington Ave
- 5221 W Montrose Ave
- 5501 W Lawrence Ave Unit 3C
- 5062 W Agatite Ave Unit 3
- 5253 W Cullom Ave
- 5043 W Sunnyside Ave
- 5410 W Hutchinson St
- 4648 N Lawler Ave
- 4631 N Lawler Ave
- 5716 W Eastwood Ave
- 5710 W Leland Ave
- 5704 W Montrose Ave Unit 2B
- 5036 W Pensacola Ave Unit 309
- 5340 W Windsor Ave Unit 3H
- 5340 W Windsor Ave Unit 3G
- 5340 W Windsor Ave Unit 1J
- 5340 W Windsor Ave Unit 1I
- 5340 W Windsor Ave Unit 2K
- 5340 W Windsor Ave Unit 1G
- 5340 W Windsor Ave Unit 3J
- 5340 W Windsor Ave Unit 1K
- 5340 W Windsor Ave Unit 3I
- 5340 W Windsor Ave Unit 2I
- 5340 W Windsor Ave Unit 2G
- 5340 W Windsor Ave Unit 1H
- 5340 W Windsor Ave Unit 2H
- 5340 W Windsor Ave Unit 3L
- 5340 W Windsor Ave Unit 3K
- 5340 W Windsor Ave Unit 2L
- 5340 W Windsor Ave Unit 2J
- 5340 W Windsor Ave Unit 1L
- 5332 W Windsor Ave Unit 2B
- 5332 W Windsor Ave Unit 3E