Estimated Value: $557,000 - $743,326
3
Beds
2
Baths
1,233
Sq Ft
$525/Sq Ft
Est. Value
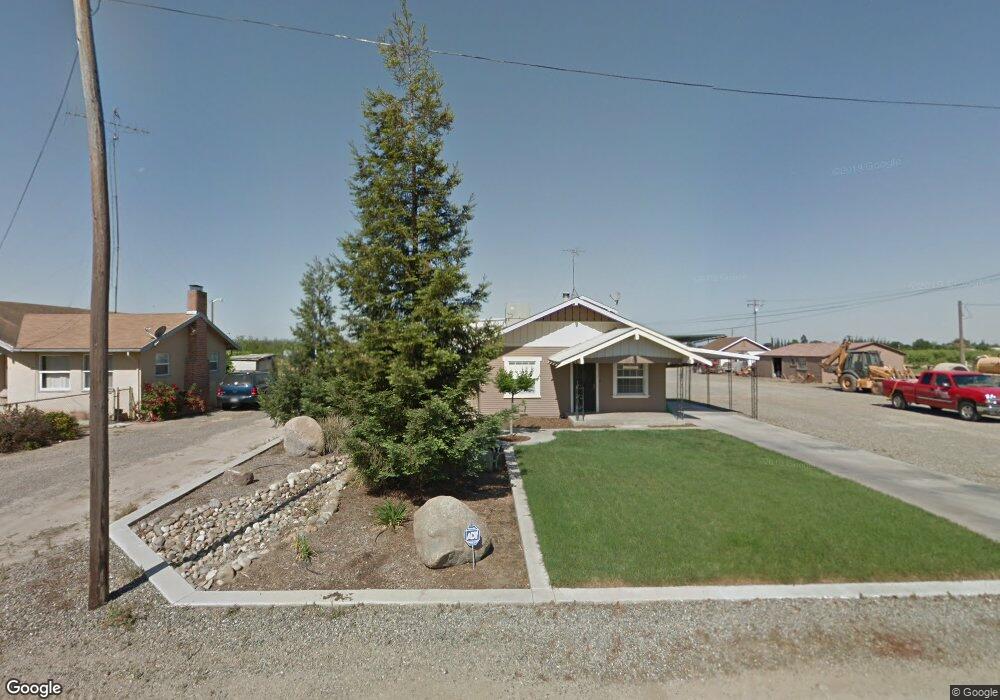
About This Home
This home is located at 5349 Moffett Rd, Ceres, CA 95307 and is currently estimated at $647,832, approximately $525 per square foot. 5349 Moffett Rd is a home located in Stanislaus County with nearby schools including Joel J. Hidahl Elementary School, Blaker-Kinser Junior High School, and Central Valley High School.
Ownership History
Date
Name
Owned For
Owner Type
Purchase Details
Closed on
Jun 9, 2020
Sold by
Haley Tanya R
Bought by
Haley Richard L
Current Estimated Value
Home Financials for this Owner
Home Financials are based on the most recent Mortgage that was taken out on this home.
Original Mortgage
$400,000
Outstanding Balance
$281,197
Interest Rate
3.2%
Mortgage Type
New Conventional
Estimated Equity
$366,635
Purchase Details
Closed on
Sep 11, 2012
Sold by
Haley Richard
Bought by
Turlock Irrigation District
Purchase Details
Closed on
Mar 18, 2003
Sold by
Spears Ruth N
Bought by
Haley Richard
Home Financials for this Owner
Home Financials are based on the most recent Mortgage that was taken out on this home.
Original Mortgage
$322,700
Interest Rate
5.54%
Purchase Details
Closed on
Sep 15, 1994
Sold by
Spears Ruth N
Bought by
Spears Ruth N and Spears Christine Lynn
Create a Home Valuation Report for This Property
The Home Valuation Report is an in-depth analysis detailing your home's value as well as a comparison with similar homes in the area
Home Values in the Area
Average Home Value in this Area
Purchase History
| Date | Buyer | Sale Price | Title Company |
|---|---|---|---|
| Haley Richard L | -- | Cypress Title Corporation | |
| Haley Richard L | -- | Cypress Title Corporation | |
| Turlock Irrigation District | $191 | None Available | |
| Haley Richard | $340,000 | Alliance Title Company | |
| Spears Ruth N | -- | Alliance Title Company | |
| Spears Ruth N | -- | -- |
Source: Public Records
Mortgage History
| Date | Status | Borrower | Loan Amount |
|---|---|---|---|
| Open | Haley Richard L | $400,000 | |
| Previous Owner | Haley Richard | $322,700 |
Source: Public Records
Tax History Compared to Growth
Tax History
| Year | Tax Paid | Tax Assessment Tax Assessment Total Assessment is a certain percentage of the fair market value that is determined by local assessors to be the total taxable value of land and additions on the property. | Land | Improvement |
|---|---|---|---|---|
| 2024 | $7,290 | $646,146 | $343,614 | $302,532 |
| 2023 | $7,091 | $633,477 | $336,877 | $296,600 |
| 2022 | $7,025 | $621,057 | $330,272 | $290,785 |
| 2021 | $6,951 | $608,881 | $323,797 | $285,084 |
| 2020 | $6,735 | $602,638 | $320,477 | $282,161 |
| 2019 | $6,688 | $590,823 | $314,194 | $276,629 |
| 2018 | $6,548 | $579,239 | $308,034 | $271,205 |
| 2017 | $4,859 | $424,285 | $301,995 | $122,290 |
| 2016 | $4,446 | $388,500 | $298,500 | $90,000 |
| 2015 | $3,199 | $278,500 | $226,000 | $52,500 |
| 2014 | $2,514 | $218,500 | $166,000 | $52,500 |
Source: Public Records
Map
Nearby Homes
- 2030 E Grayson Rd Unit 18
- 3221 E Redwood Rd
- 4812 Esmar Rd Unit 3
- 4812 Esmar Rd Unit 2
- 4812 Esmar Rd Unit 12
- 4812 Esmar Rd Unit 7
- 5117 Bogart Dr
- 3330 E Service Rd
- 4837 Faith Home Rd Unit 102
- 4837 Faith Home Rd Unit 181
- 4837 Faith Home Rd Unit 4
- 4837 Faith Home Rd Unit 91
- 4021 Anna Ave
- 3817 Collins Rd
- 3939 Central Ave Unit 84
- 3939 Central Ave Unit 35
- 3804 Christy Ln
- 3460 E Service Rd
- 4208 Esmail Ave
- 3632 9th St
- 5361 Moffett Rd
- 5373 Moffett Rd
- 5366 Moffett Rd
- 5423 Moffett Rd
- 5400 Moffett Rd
- 5425 Moffett Rd
- 5354 Moffett Rd
- 5301 Moffett Rd
- 5430 Moffett Rd
- 5248 Moffett Rd
- 0 Moffett Rd Unit 20049224
- 0 Moffett Rd
- 5236 Moffett Rd
- 5537 Moffett Rd
- 2542 Turner Rd
- 2624 Turner Rd
- 2444 Turner Rd
- 2549 Turner Rd
- 2613 Turner Rd
- 2513 Turner Rd