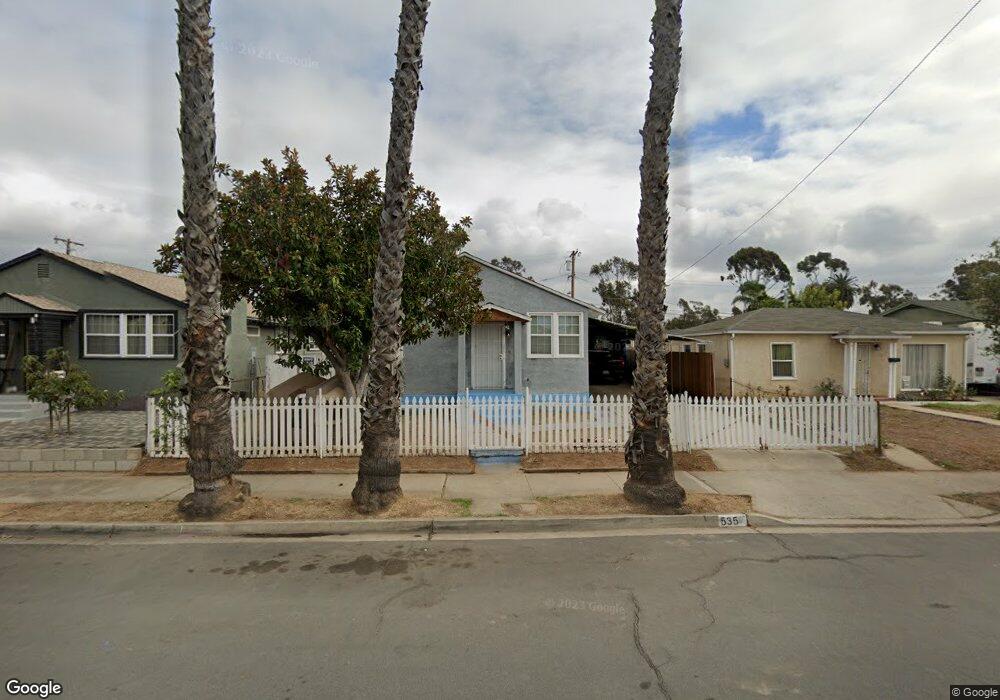
535 West St San Diego, CA 92113
Mountain View NeighborhoodEstimated Value: $567,000 - $695,000
2
Beds
1
Bath
910
Sq Ft
$695/Sq Ft
Est. Value
About This Home
This home is located at 535 West St, San Diego, CA 92113 and is currently estimated at $632,066, approximately $694 per square foot. 535 West St is a home located in San Diego County with nearby schools including Porter Elementary School, Knox Middle, and Lincoln High School.
Ownership History
Date
Name
Owned For
Owner Type
Purchase Details
Closed on
Dec 6, 2005
Sold by
Vazquez Salvador
Bought by
Vazquez Salvador and Vazquez Maria Cristina
Current Estimated Value
Home Financials for this Owner
Home Financials are based on the most recent Mortgage that was taken out on this home.
Original Mortgage
$200,000
Interest Rate
6.35%
Mortgage Type
Stand Alone Refi Refinance Of Original Loan
Purchase Details
Closed on
Dec 12, 2002
Sold by
Vazquez Salvador and Vazquez Norma
Bought by
Vazquez Salvador
Home Financials for this Owner
Home Financials are based on the most recent Mortgage that was taken out on this home.
Original Mortgage
$68,000
Interest Rate
6.03%
Purchase Details
Closed on
Aug 19, 1997
Sold by
Vazquez Salvador D
Bought by
Vazquez Salvador and Vazquez Norma
Home Financials for this Owner
Home Financials are based on the most recent Mortgage that was taken out on this home.
Original Mortgage
$63,750
Interest Rate
7.43%
Purchase Details
Closed on
Jan 11, 1996
Sold by
Vazquez Salvador D and Vazquez Norma A
Bought by
Vazquez Salvador
Create a Home Valuation Report for This Property
The Home Valuation Report is an in-depth analysis detailing your home's value as well as a comparison with similar homes in the area
Home Values in the Area
Average Home Value in this Area
Purchase History
| Date | Buyer | Sale Price | Title Company |
|---|---|---|---|
| Vazquez Salvador | -- | Ticor Title Co Of California | |
| Vazquez Salvador | -- | -- | |
| Vazquez Salvador | -- | American Title Co | |
| Vazquez Salvador | -- | -- |
Source: Public Records
Mortgage History
| Date | Status | Borrower | Loan Amount |
|---|---|---|---|
| Closed | Vazquez Salvador | $200,000 | |
| Closed | Vazquez Salvador | $68,000 | |
| Closed | Vazquez Salvador | $63,750 |
Source: Public Records
Tax History Compared to Growth
Tax History
| Year | Tax Paid | Tax Assessment Tax Assessment Total Assessment is a certain percentage of the fair market value that is determined by local assessors to be the total taxable value of land and additions on the property. | Land | Improvement |
|---|---|---|---|---|
| 2025 | $410 | $31,126 | $12,905 | $18,221 |
| 2024 | $410 | $30,516 | $12,652 | $17,864 |
| 2023 | $400 | $29,918 | $12,404 | $17,514 |
| 2022 | $390 | $29,332 | $12,161 | $17,171 |
| 2021 | $387 | $28,758 | $11,923 | $16,835 |
| 2020 | $383 | $28,464 | $11,801 | $16,663 |
| 2019 | $377 | $27,907 | $11,570 | $16,337 |
| 2018 | $354 | $27,361 | $11,344 | $16,017 |
| 2017 | $80 | $26,825 | $11,122 | $15,703 |
| 2016 | $338 | $26,300 | $10,904 | $15,396 |
| 2015 | $334 | $25,906 | $10,741 | $15,165 |
| 2014 | $330 | $25,399 | $10,531 | $14,868 |
Source: Public Records
Map
Nearby Homes
- 420 S 45th St
- 4452 Benfield Ct
- 745 West St
- 812 West St
- 635 S 47th St Unit 37
- 4547 Imperial Ave
- 325 Gloria St
- 4895 Bunnell St
- 4300 Newton Ave Unit 31
- 4300 Newton Ave Unit 106
- 4300 Newton Ave Unit 45
- 4300 Newton Ave Unit 29
- 722 S 42nd St
- 237 S Willie James Jones Ave
- 4117 Jamul Ave
- 431 Cuyamaca Ave
- 5033 La Paz Dr
- 4064 National Ave
- 1149 S 41st St Unit 27
- 222 50th St