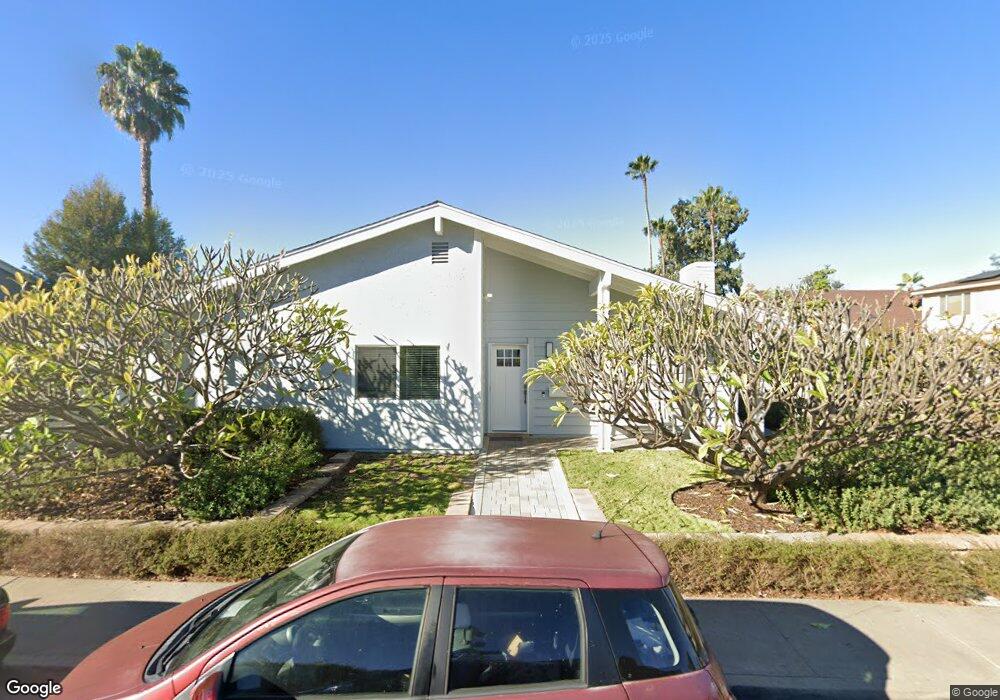
5356 Jazmin Ct San Diego, CA 92124
Tierrasanta NeighborhoodEstimated Value: $1,006,030 - $1,118,000
3
Beds
2
Baths
1,236
Sq Ft
$876/Sq Ft
Est. Value
About This Home
This home is located at 5356 Jazmin Ct, San Diego, CA 92124 and is currently estimated at $1,082,508, approximately $875 per square foot. 5356 Jazmin Ct is a home located in San Diego County with nearby schools including Tierrasanta Elementary, De Portola Middle School, and Farb Middle School.
Ownership History
Date
Name
Owned For
Owner Type
Purchase Details
Closed on
May 14, 2024
Sold by
Fox Lorang Trust and Lorang Philip A
Bought by
Philip A Lorang Trust and Lorang
Current Estimated Value
Purchase Details
Closed on
Aug 23, 2022
Sold by
Alphonse Lorang Philip and Fox Ellen
Bought by
Fox Lorang Trust
Purchase Details
Closed on
Feb 24, 2016
Sold by
Momita Stacy M
Bought by
Lorang Philip Alphonse and Lorang Ellen Fox
Home Financials for this Owner
Home Financials are based on the most recent Mortgage that was taken out on this home.
Original Mortgage
$417,000
Interest Rate
3.72%
Mortgage Type
New Conventional
Purchase Details
Closed on
Jun 13, 2011
Sold by
Shimamoto Nancy K
Bought by
Momita Stacy M
Purchase Details
Closed on
Mar 7, 2002
Sold by
Shimamoto Robert Kiyoshi
Bought by
Kiyoshi Robert
Create a Home Valuation Report for This Property
The Home Valuation Report is an in-depth analysis detailing your home's value as well as a comparison with similar homes in the area
Home Values in the Area
Average Home Value in this Area
Purchase History
| Date | Buyer | Sale Price | Title Company |
|---|---|---|---|
| Philip A Lorang Trust | -- | None Listed On Document | |
| Fox Lorang Trust | -- | None Listed On Document | |
| Lorang Philip Alphonse | $540,000 | Corinthian Title Company | |
| Momita Stacy M | -- | None Available | |
| Kiyoshi Robert | -- | -- |
Source: Public Records
Mortgage History
| Date | Status | Borrower | Loan Amount |
|---|---|---|---|
| Previous Owner | Lorang Philip Alphonse | $417,000 |
Source: Public Records
Tax History Compared to Growth
Tax History
| Year | Tax Paid | Tax Assessment Tax Assessment Total Assessment is a certain percentage of the fair market value that is determined by local assessors to be the total taxable value of land and additions on the property. | Land | Improvement |
|---|---|---|---|---|
| 2025 | $7,746 | $639,241 | $488,316 | $150,925 |
| 2024 | $7,746 | $626,708 | $478,742 | $147,966 |
| 2023 | $7,571 | $614,420 | $469,355 | $145,065 |
| 2022 | $7,364 | $602,373 | $460,152 | $142,221 |
| 2021 | $7,307 | $590,563 | $451,130 | $139,433 |
| 2020 | $7,218 | $584,509 | $446,505 | $138,004 |
| 2019 | $7,088 | $573,049 | $437,750 | $135,299 |
| 2018 | $6,627 | $561,814 | $429,167 | $132,647 |
| 2017 | $80 | $550,799 | $420,752 | $130,047 |
| 2016 | $4,597 | $389,610 | $297,620 | $91,990 |
| 2015 | $4,528 | $383,759 | $293,150 | $90,609 |
| 2014 | $4,456 | $376,243 | $287,408 | $88,835 |
Source: Public Records
Map
Nearby Homes
- 10828 Lamentin Ct Unit 313
- 10812 Lamentin Ct Unit 312
- 10889 Lamentin Ct
- 10834 Caravelle Place
- 5137 Abuela Dr
- 10706 Esmeraldas Dr Unit 6
- 10690 Esmeraldas Dr
- 10748 Escobar Dr
- 5059 La Cuenta Dr
- 10852 Carbet Place
- 10908 Avenida Playa Veracruz
- 6140 Calle Mariselda Unit 102
- 4375 Calle de Vida
- 4989 Corte Playa Encino
- 10617 Escobar Dr Unit 4
- 6161 Calle Mariselda Unit 408
- 5238 Camino Playa Malaga
- 10853 Valldemosa Ln
- 10437 Hermanos Rd
- 4755 Mayita Way
- 5362 Jazmin Ct
- 5350 Jazmin Ct
- 5374 Jazmin Ct
- 5344 Jazmin Ct
- 5368 Jazmin Ct
- 5359 Jazmin Ct
- 5349 Jazmin Ct
- 5355 La Cuenta Dr
- 5365 La Cuenta Dr
- 5369 Jazmin Ct
- 5332 Jazmin Ct
- 10887 Montego Dr
- 5331 Jazmin Ct
- 5336 Jazmin Ct
- 5345 La Cuenta Dr
- 10877 Montego Dr
- 5375 La Cuenta Dr
- 5337 Jazmin Ct
- 5348 Aduar Ct
- 5379 Jazmin Ct