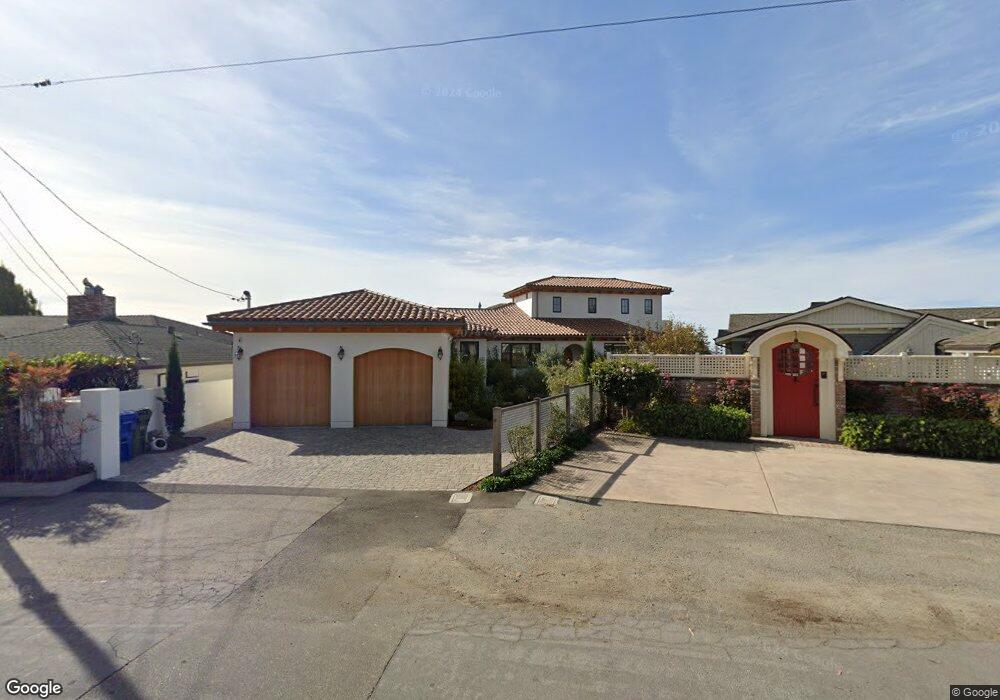
536 Bayview Dr Aptos, CA 95003
Rio del Mar NeighborhoodEstimated Value: $4,376,719 - $4,658,000
4
Beds
4
Baths
4,924
Sq Ft
$920/Sq Ft
Est. Value
About This Home
This home is located at 536 Bayview Dr, Aptos, CA 95003 and is currently estimated at $4,528,240, approximately $919 per square foot. 536 Bayview Dr is a home located in Santa Cruz County with nearby schools including Rio Del Mar Elementary School, Aptos Junior High School, and Aptos High School.
Ownership History
Date
Name
Owned For
Owner Type
Purchase Details
Closed on
Apr 21, 2021
Sold by
Ravizza Living Trust and Long Claranne Ravizza
Bought by
Mar Trust and Long
Current Estimated Value
Purchase Details
Closed on
Sep 24, 2015
Sold by
Ravizza Eugene A and The Ravizza Living Trust
Bought by
Ravizza Eugene A and The Ravizza Living Trust
Purchase Details
Closed on
Jun 20, 1994
Sold by
Longacre Robert and Longacre Jacqueline
Bought by
Ravizza Eugene A and Ravizza Mary Dianne
Home Financials for this Owner
Home Financials are based on the most recent Mortgage that was taken out on this home.
Original Mortgage
$450,000
Interest Rate
5.62%
Create a Home Valuation Report for This Property
The Home Valuation Report is an in-depth analysis detailing your home's value as well as a comparison with similar homes in the area
Home Values in the Area
Average Home Value in this Area
Purchase History
| Date | Buyer | Sale Price | Title Company |
|---|---|---|---|
| Mar Trust | -- | None Listed On Document | |
| Gst Exempt Mar Trust | -- | None Listed On Document | |
| Ravizza Eugene A | -- | None Available | |
| Ravizza Eugene A | $900,000 | Old Republic Title Company |
Source: Public Records
Mortgage History
| Date | Status | Borrower | Loan Amount |
|---|---|---|---|
| Previous Owner | Ravizza Eugene A | $450,000 |
Source: Public Records
Tax History
| Year | Tax Paid | Tax Assessment Tax Assessment Total Assessment is a certain percentage of the fair market value that is determined by local assessors to be the total taxable value of land and additions on the property. | Land | Improvement |
|---|---|---|---|---|
| 2025 | $41,456 | $3,792,956 | $2,677,246 | $1,115,710 |
| 2023 | $40,790 | $3,645,671 | $2,573,285 | $1,072,386 |
| 2022 | $36,466 | $3,244,225 | $2,522,828 | $721,397 |
| 2021 | $16,491 | $1,413,255 | $863,657 | $549,598 |
| 2020 | $16,226 | $1,398,764 | $854,801 | $543,963 |
| 2019 | $15,941 | $1,371,337 | $838,040 | $533,297 |
| 2018 | $15,521 | $1,344,449 | $821,608 | $522,841 |
| 2017 | $15,391 | $1,318,086 | $805,498 | $512,588 |
| 2016 | $14,998 | $1,292,242 | $789,704 | $502,538 |
| 2015 | $14,902 | $1,272,831 | $777,842 | $494,989 |
| 2014 | $14,565 | $1,247,898 | $762,605 | $485,293 |
Source: Public Records
Map
Nearby Homes
- 532 Bayview Dr
- 545 Beach Dr
- 619 Beach Dr
- 433 Seaview Dr
- 621 Beach Dr
- 457 Townsend Dr
- 105 Dunsmuir Ct Unit 1
- 322 Arthur Ave
- 320 Cliff Dr
- 227 Kingsbury Dr
- 325 Beach Dr
- 273 Rio Del Mar Blvd
- 424 Palmer Ave
- 240 Rio Del Mar Blvd Unit O
- 600 Saint Andrews Dr
- 607 Saint Andrews Dr
- 229 Rio Del Mar Blvd
- 640 Saint Andrews Dr
- 220 Beach Dr
- 140 Marina Ave Unit A
Your Personal Tour Guide
Ask me questions while you tour the home.