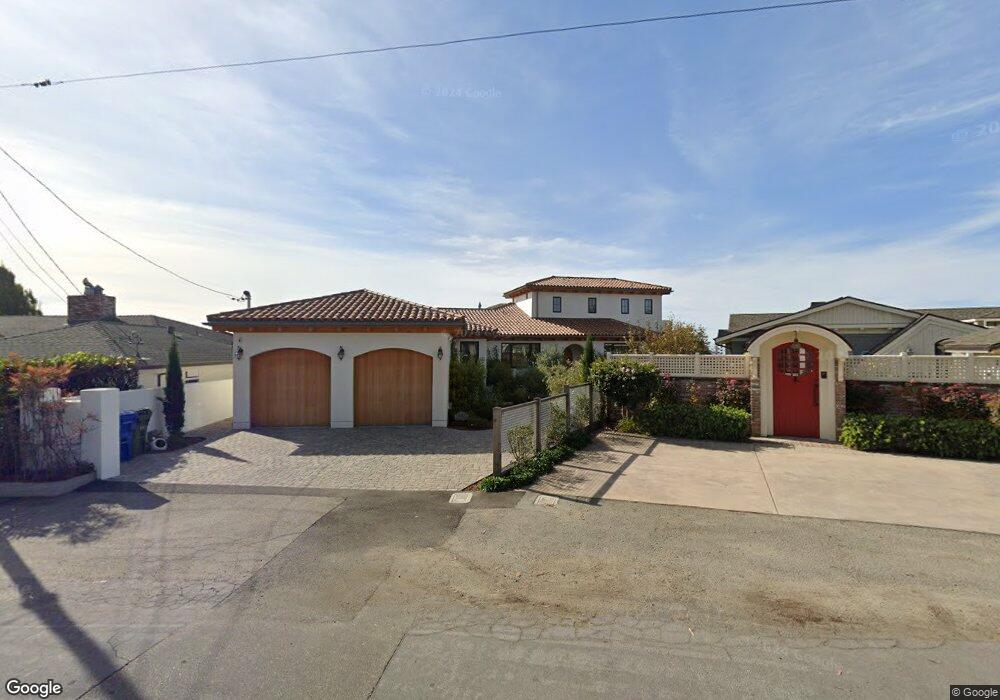
536 Bayview Dr Aptos, CA 95003
Rio del Mar NeighborhoodEstimated Value: $4,180,000 - $4,681,658
About This Home
This home is located at 536 Bayview Dr, Aptos, CA 95003 and is currently estimated at $4,421,165, approximately $897 per square foot. 536 Bayview Dr is a home located in Santa Cruz County with nearby schools including Rio Del Mar Elementary School, Aptos Junior High School, and Aptos High School.
Ownership History
We collect this data history from publicly available records. To have your information removed, we recommend requesting removal directly through your county’s website.
Purchase Details
Purchase Details
Purchase Details
Home Financials for this Owner
Home Financials are based on the most recent Mortgage that was taken out on this home.Home Values in the Area
Average Home Value in this Area
Purchase History
We collect this data history from publicly available records. To have your information removed, we recommend requesting removal directly through your county’s website.
| Date | Buyer | Sale Price | Title Company |
|---|---|---|---|
| -- | None Listed On Document | ||
| -- | None Listed On Document | ||
| -- | None Available | ||
| $900,000 | Old Republic Title Company |
Mortgage History
We collect this data history from publicly available records. To have your information removed, we recommend requesting removal directly through your county’s website.
| Date | Status | Borrower | Loan Amount |
|---|---|---|---|
| Previous Owner | $450,000 |
Tax History
We collect this data history from publicly available records. To have your information removed, we recommend requesting removal directly through your county’s website.
| Year | Tax Paid | Tax Assessment Tax Assessment Total Assessment is a certain percentage of the fair market value that is determined by local assessors to be the total taxable value of land and additions on the property. | Land | Improvement |
|---|---|---|---|---|
| 2025 | $41,456 | $3,792,956 | $2,677,246 | $1,115,710 |
| 2023 | $40,790 | $3,645,671 | $2,573,285 | $1,072,386 |
| 2022 | $36,466 | $3,244,225 | $2,522,828 | $721,397 |
| 2021 | $16,491 | $1,413,255 | $863,657 | $549,598 |
| 2020 | $16,226 | $1,398,764 | $854,801 | $543,963 |
| 2019 | $15,941 | $1,371,337 | $838,040 | $533,297 |
| 2018 | $15,521 | $1,344,449 | $821,608 | $522,841 |
| 2017 | $15,391 | $1,318,086 | $805,498 | $512,588 |
| 2016 | $14,998 | $1,292,242 | $789,704 | $502,538 |
| 2015 | $14,902 | $1,272,831 | $777,842 | $494,989 |
| 2014 | $14,565 | $1,247,898 | $762,605 | $485,293 |
Map
- 535 Beach Dr
- 545 Beach Dr
- 548 Beach Dr
- 519 Cliff Dr
- 619 Beach Dr
- 457 Townsend Dr
- 517 Sumner Ave
- 634 Townsend Dr
- 643 Beach Dr
- 322 Arthur Ave
- 339 Beach Dr
- 273 Rio Del Mar Blvd
- 587 Saint Andrews Dr
- 877 Via Gaviota
- 607 Saint Andrews Dr
- 264 Beach Dr
- 230 Rio Del Mar Blvd Unit K
- 419 Ewell Ave
- 465 Los Altos Dr
- 525 Clubhouse Dr
Ask me questions while you tour the home.