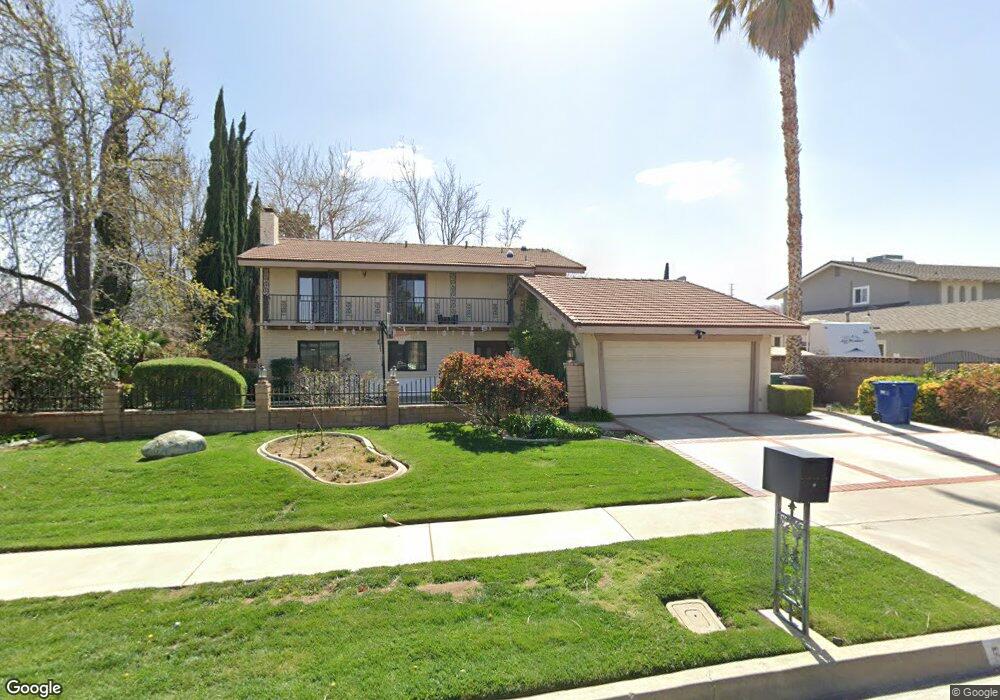
536 Fantasy St Palmdale, CA 93551
West Palmdale NeighborhoodEstimated Value: $568,000 - $692,000
3
Beds
3
Baths
2,874
Sq Ft
$214/Sq Ft
Est. Value
About This Home
This home is located at 536 Fantasy St, Palmdale, CA 93551 and is currently estimated at $615,583, approximately $214 per square foot. 536 Fantasy St is a home located in Los Angeles County with nearby schools including Summerwind Elementary School, David G. Millen Magnet Academy, and Highland High School.
Ownership History
Date
Name
Owned For
Owner Type
Purchase Details
Closed on
Apr 22, 2020
Sold by
Burnias Gregory P and Burnias Shanel C
Bought by
Burnias Gregory P and Burnias Shanel C
Current Estimated Value
Home Financials for this Owner
Home Financials are based on the most recent Mortgage that was taken out on this home.
Original Mortgage
$260,000
Outstanding Balance
$229,891
Interest Rate
3.3%
Mortgage Type
New Conventional
Estimated Equity
$385,692
Purchase Details
Closed on
Feb 16, 2017
Sold by
Burnias Gilbert C
Bought by
Burnias Gilbert C and Burnias Gregory P
Home Financials for this Owner
Home Financials are based on the most recent Mortgage that was taken out on this home.
Original Mortgage
$232,500
Interest Rate
4.12%
Mortgage Type
New Conventional
Purchase Details
Closed on
Jan 25, 1999
Sold by
Trust Bright Charles W Co Tr Bright Fami and Bright Donna M
Bought by
Burnias Gilbert C
Home Financials for this Owner
Home Financials are based on the most recent Mortgage that was taken out on this home.
Original Mortgage
$171,031
Interest Rate
6.76%
Create a Home Valuation Report for This Property
The Home Valuation Report is an in-depth analysis detailing your home's value as well as a comparison with similar homes in the area
Home Values in the Area
Average Home Value in this Area
Purchase History
| Date | Buyer | Sale Price | Title Company |
|---|---|---|---|
| Burnias Gregory P | -- | Wfg National Title Co Of Ca | |
| Burnias Gilbert C | -- | Wfg National Title Co Of Ca | |
| Burnias Gilbert C | $184,500 | Fidelity National Title Co |
Source: Public Records
Mortgage History
| Date | Status | Borrower | Loan Amount |
|---|---|---|---|
| Open | Burnias Gregory P | $260,000 | |
| Closed | Burnias Gilbert C | $232,500 | |
| Closed | Burnias Gilbert C | $171,031 |
Source: Public Records
Tax History Compared to Growth
Tax History
| Year | Tax Paid | Tax Assessment Tax Assessment Total Assessment is a certain percentage of the fair market value that is determined by local assessors to be the total taxable value of land and additions on the property. | Land | Improvement |
|---|---|---|---|---|
| 2025 | $4,669 | $289,217 | $45,448 | $243,769 |
| 2024 | $4,669 | $283,547 | $44,557 | $238,990 |
| 2023 | $4,592 | $277,988 | $43,684 | $234,304 |
| 2022 | $4,433 | $272,538 | $42,828 | $229,710 |
| 2021 | $4,332 | $267,195 | $41,989 | $225,206 |
| 2020 | $4,288 | $264,456 | $41,559 | $222,897 |
| 2019 | $4,227 | $259,272 | $40,745 | $218,527 |
| 2018 | $4,156 | $254,190 | $39,947 | $214,243 |
| 2016 | $3,838 | $244,322 | $38,397 | $205,925 |
| 2015 | $3,803 | $240,653 | $37,821 | $202,832 |
| 2014 | $3,739 | $235,940 | $37,081 | $198,859 |
Source: Public Records
Map
Nearby Homes
- 39752 Makin Ave
- 450 Fairway Dr
- 431 Fantasy St
- 433 Fairway Dr
- 310 Susan Ct
- 39884 Golfers Dr
- 0 Highway 14 and Ave P-4 Unit 41053587
- 0 Highway 14 and Ave P-4 Unit 24002024
- 39366 11th St W
- 241 W Quail Dr
- 0 E Avenue P Unit 25573301
- 0 E Avenue P Unit HD25170460
- 0 E Avenue P Unit HD25214817
- 206 Hawk Ln
- 236 Hawk Ln
- 240 Tavern Creek Ln
- 1225 Stanfill Rd
- 1234 Wellington Dr
- 40127 Pevero Ct
- 203 E Avenue p4
- 530 Fantasy St
- 544 Fantasy St
- 519 Callet St
- 501 Callet St
- 527 Callet St
- 39700 Eadmer Ave
- 39631 Joline Ave
- 600 Fantasy St
- 535 Callet St
- 516 Fantasy St
- 39710 Eadmer Ave
- 39701 Eadmer Ave
- 39608 Joline Ave
- 608 Fantasy St
- 39641 Joline Ave
- 512 Callet St
- 522 Callet St
- 545 Callet St
- 39630 Joline Ave
- 530 Callet St