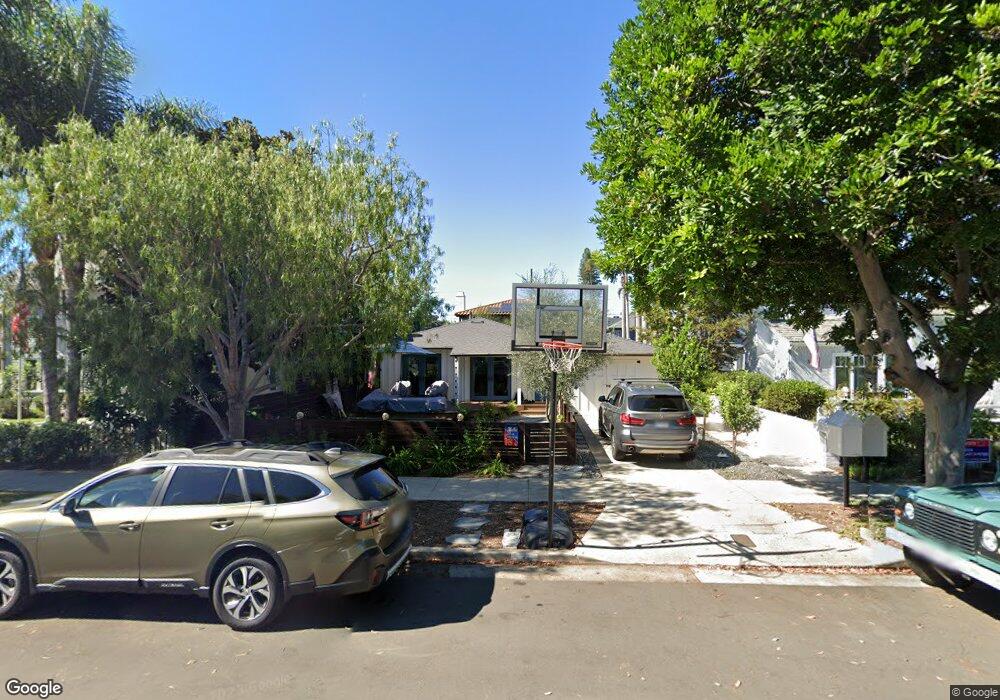
536 I Ave Coronado, CA 92118
Estimated Value: $2,086,299 - $2,813,000
3
Beds
1
Bath
1,040
Sq Ft
$2,308/Sq Ft
Est. Value
About This Home
This home is located at 536 I Ave, Coronado, CA 92118 and is currently estimated at $2,400,575, approximately $2,308 per square foot. 536 I Ave is a home located in San Diego County with nearby schools including Coronado Village Elementary, Coronado Middle School, and Coronado High School.
Ownership History
Date
Name
Owned For
Owner Type
Purchase Details
Closed on
Aug 5, 2020
Sold by
Rose Robert N and Rotkosky Nicole
Bought by
Rose Robert Nelson and Rotkosky Nicole
Current Estimated Value
Purchase Details
Closed on
Jan 16, 2015
Sold by
Olsen Charles Lewis and Olsen Cynthia Ann
Bought by
Rose Robert N and Rotkosky Nicole
Home Financials for this Owner
Home Financials are based on the most recent Mortgage that was taken out on this home.
Original Mortgage
$1,087,425
Outstanding Balance
$827,351
Interest Rate
3.66%
Mortgage Type
VA
Estimated Equity
$1,573,224
Purchase Details
Closed on
Oct 1, 2009
Sold by
Olsen Cynthia Ann
Bought by
Olsen Charles Lewis and Olsen Cynthia Ann
Purchase Details
Closed on
Nov 26, 2007
Sold by
Faughman F P
Bought by
Faughman F P
Create a Home Valuation Report for This Property
The Home Valuation Report is an in-depth analysis detailing your home's value as well as a comparison with similar homes in the area
Home Values in the Area
Average Home Value in this Area
Purchase History
| Date | Buyer | Sale Price | Title Company |
|---|---|---|---|
| Rose Robert Nelson | -- | None Available | |
| Rose Robert N | $1,250,000 | First American Title | |
| Olsen Charles Lewis | -- | None Available | |
| Olsen Cynthia Ann | -- | None Available | |
| Faughman F P | -- | None Available |
Source: Public Records
Mortgage History
| Date | Status | Borrower | Loan Amount |
|---|---|---|---|
| Open | Rose Robert N | $1,087,425 |
Source: Public Records
Tax History
| Year | Tax Paid | Tax Assessment Tax Assessment Total Assessment is a certain percentage of the fair market value that is determined by local assessors to be the total taxable value of land and additions on the property. | Land | Improvement |
|---|---|---|---|---|
| 2025 | $9,677 | $1,051,609 | $751,152 | $300,457 |
| 2024 | $9,677 | $1,030,990 | $736,424 | $294,566 |
| 2023 | $9,584 | $1,010,776 | $721,985 | $288,791 |
| 2022 | $9,492 | $990,958 | $707,829 | $283,129 |
| 2021 | $9,352 | $971,528 | $693,950 | $277,578 |
| 2020 | $10,613 | $961,567 | $686,835 | $274,732 |
| 2019 | $10,579 | $942,714 | $673,368 | $269,346 |
| 2018 | $10,403 | $924,230 | $660,165 | $264,065 |
| 2017 | $20 | $906,109 | $647,221 | $258,888 |
| 2016 | $9,876 | $888,343 | $634,531 | $253,812 |
| 2015 | $1,117 | $57,240 | $38,812 | $18,428 |
| 2014 | $1,056 | $56,120 | $38,052 | $18,068 |
Source: Public Records
Map
Nearby Homes
Your Personal Tour Guide
Ask me questions while you tour the home.