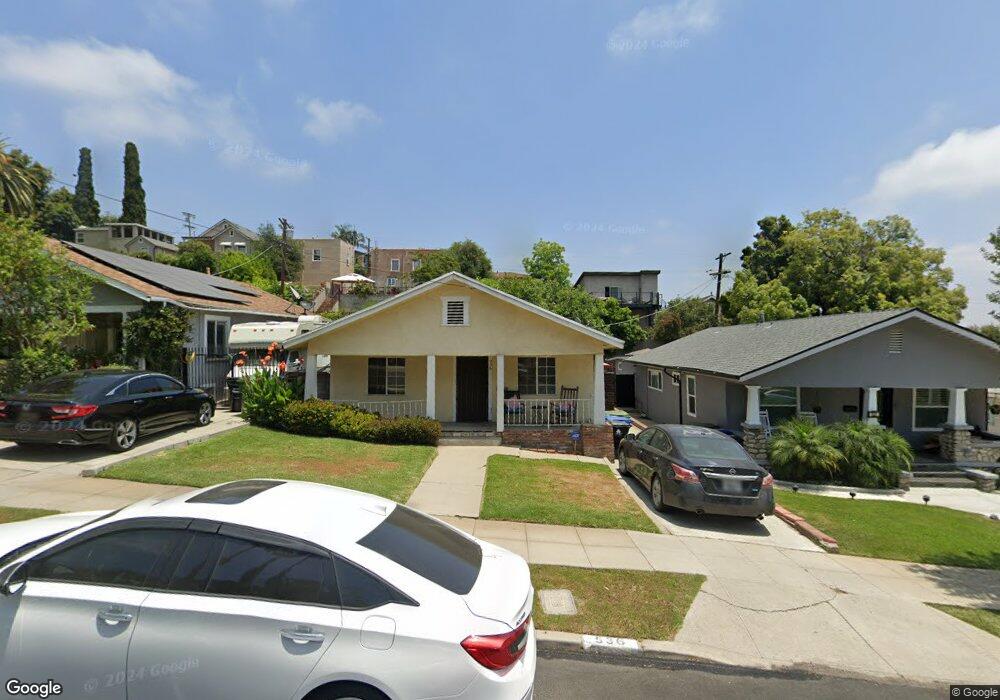
536 Meridian Terrace Los Angeles, CA 90042
Estimated Value: $927,349 - $1,090,000
3
Beds
1
Bath
1,116
Sq Ft
$904/Sq Ft
Est. Value
About This Home
This home is located at 536 Meridian Terrace, Los Angeles, CA 90042 and is currently estimated at $1,009,337, approximately $904 per square foot. 536 Meridian Terrace is a home located in Los Angeles County with nearby schools including Yorkdale Elementary, Garvanza Elementary, and Luther Burbank Middle School.
Ownership History
Date
Name
Owned For
Owner Type
Purchase Details
Closed on
Aug 31, 2009
Sold by
Citimortgage Inc
Bought by
Campbell Craig T
Current Estimated Value
Home Financials for this Owner
Home Financials are based on the most recent Mortgage that was taken out on this home.
Original Mortgage
$255,290
Outstanding Balance
$166,874
Interest Rate
5.18%
Mortgage Type
FHA
Estimated Equity
$842,463
Purchase Details
Closed on
May 11, 2009
Sold by
Torres Dony
Bought by
Citimortgage Inc
Purchase Details
Closed on
Oct 5, 2006
Sold by
Smith Kathleen A and Anderson Revocable Living Trus
Bought by
Torres Dony
Home Financials for this Owner
Home Financials are based on the most recent Mortgage that was taken out on this home.
Original Mortgage
$423,200
Interest Rate
7.2%
Mortgage Type
Purchase Money Mortgage
Purchase Details
Closed on
Feb 23, 2005
Sold by
Anderson Margaret
Bought by
Anderson Margaret M
Create a Home Valuation Report for This Property
The Home Valuation Report is an in-depth analysis detailing your home's value as well as a comparison with similar homes in the area
Home Values in the Area
Average Home Value in this Area
Purchase History
| Date | Buyer | Sale Price | Title Company |
|---|---|---|---|
| Campbell Craig T | $260,000 | First American Title | |
| Citimortgage Inc | $232,200 | First American Title Ins Co | |
| Torres Dony | $529,000 | California Title Company | |
| Anderson Margaret M | -- | -- |
Source: Public Records
Mortgage History
| Date | Status | Borrower | Loan Amount |
|---|---|---|---|
| Open | Campbell Craig T | $255,290 | |
| Previous Owner | Torres Dony | $423,200 |
Source: Public Records
Tax History Compared to Growth
Tax History
| Year | Tax Paid | Tax Assessment Tax Assessment Total Assessment is a certain percentage of the fair market value that is determined by local assessors to be the total taxable value of land and additions on the property. | Land | Improvement |
|---|---|---|---|---|
| 2025 | $4,169 | $335,596 | $220,593 | $115,003 |
| 2024 | $4,169 | $329,017 | $216,268 | $112,749 |
| 2023 | $4,091 | $322,567 | $212,028 | $110,539 |
| 2022 | $3,902 | $316,243 | $207,871 | $108,372 |
| 2021 | $3,852 | $310,044 | $203,796 | $106,248 |
| 2019 | $3,738 | $300,850 | $197,752 | $103,098 |
| 2018 | $3,664 | $294,952 | $193,875 | $101,077 |
| 2017 | $3,499 | $289,170 | $190,074 | $99,096 |
| 2016 | $3,411 | $283,501 | $186,348 | $97,153 |
| 2015 | $3,361 | $279,243 | $183,549 | $95,694 |
| 2014 | $3,377 | $273,774 | $179,954 | $93,820 |
Source: Public Records
Map
Nearby Homes
- 549 Meridian Terrace
- 560 Neva Place
- 576 Neva Place
- 310 Branch St
- 5807 Meridian St
- 1057 Milwaukee Ave
- 215 Branch St
- 6225 Beard St
- 355 Kirby St
- 6190 Mesa Ave
- 5711 Stratford Rd
- 234 Newland St
- 6218 Saylin Ln
- 1408 Highgate Ave
- 1425 Highgate Ave
- 328 Vista Place
- 6050 Burwood Ave
- 6849 N Figueroa St
- 263 Lamont Dr
- 6048 Burwood Ave
- 540 Meridian Terrace
- 532 Meridian Terrace
- 544 Meridian Terrace
- 528 Meridian Terrace
- 541 Neva Place
- 548 Meridian Terrace
- 524 Meridian Terrace
- 537 Neva Place
- 545 Neva Place
- 533 Neva Place
- 549 Neva Place
- 552 Meridian Terrace
- 520 Meridian Terrace
- 533 Meridian Terrace
- 529 Neva Place
- 553 Neva Place
- 537 Meridian Terrace
- 529 Meridian Terrace
- 541 Meridian Terrace
- 525 Meridian Terrace