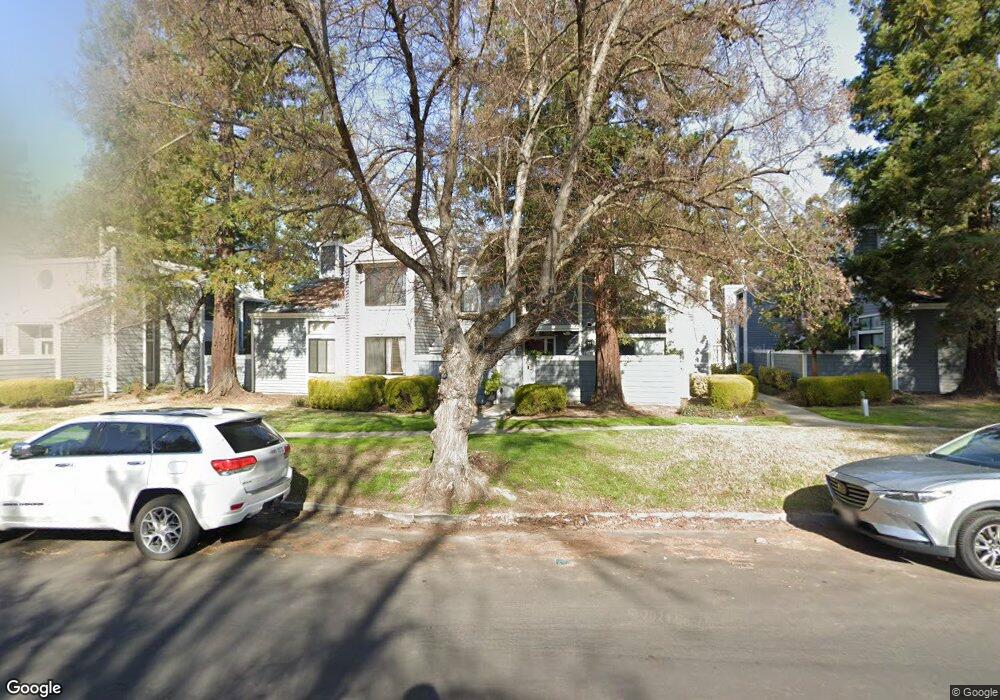
5361 Black Ave Unit 1 Pleasanton, CA 94566
Amador Valley NeighborhoodEstimated Value: $761,000 - $928,000
3
Beds
3
Baths
1,690
Sq Ft
$515/Sq Ft
Est. Value
About This Home
This home is located at 5361 Black Ave Unit 1, Pleasanton, CA 94566 and is currently estimated at $870,146, approximately $514 per square foot. 5361 Black Ave Unit 1 is a home located in Alameda County with nearby schools including Walnut Grove Elementary School, Harvest Park Middle School, and Amador Valley High School.
Ownership History
Date
Name
Owned For
Owner Type
Purchase Details
Closed on
May 18, 2009
Sold by
Lerch Mary B
Bought by
The Mary B Lerch Trust
Current Estimated Value
Home Financials for this Owner
Home Financials are based on the most recent Mortgage that was taken out on this home.
Original Mortgage
$180,000
Outstanding Balance
$113,422
Interest Rate
4.8%
Mortgage Type
New Conventional
Estimated Equity
$756,724
Purchase Details
Closed on
Jun 25, 2008
Sold by
Lerch Mary B
Bought by
The Mary B Lerch Living Trust
Purchase Details
Closed on
Dec 7, 1994
Sold by
Russick Andrew K and Russick Kathleen M
Bought by
Lerch Mary B
Home Financials for this Owner
Home Financials are based on the most recent Mortgage that was taken out on this home.
Original Mortgage
$163,700
Interest Rate
9.1%
Create a Home Valuation Report for This Property
The Home Valuation Report is an in-depth analysis detailing your home's value as well as a comparison with similar homes in the area
Home Values in the Area
Average Home Value in this Area
Purchase History
| Date | Buyer | Sale Price | Title Company |
|---|---|---|---|
| The Mary B Lerch Trust | -- | First American Title Company | |
| Lerch Mary B | -- | First American Title Company | |
| The Mary B Lerch Living Trust | -- | None Available | |
| Lerch Mary B | $182,000 | Placer Title Company |
Source: Public Records
Mortgage History
| Date | Status | Borrower | Loan Amount |
|---|---|---|---|
| Open | Lerch Mary B | $180,000 | |
| Closed | Lerch Mary B | $163,700 |
Source: Public Records
Tax History Compared to Growth
Tax History
| Year | Tax Paid | Tax Assessment Tax Assessment Total Assessment is a certain percentage of the fair market value that is determined by local assessors to be the total taxable value of land and additions on the property. | Land | Improvement |
|---|---|---|---|---|
| 2025 | $3,506 | $298,520 | $91,706 | $213,814 |
| 2024 | $3,506 | $292,530 | $89,908 | $209,622 |
| 2023 | $3,464 | $293,659 | $88,146 | $205,513 |
| 2022 | $3,281 | $280,902 | $86,418 | $201,484 |
| 2021 | $3,196 | $275,256 | $84,723 | $197,533 |
| 2020 | $3,154 | $279,363 | $83,855 | $195,508 |
| 2019 | $3,190 | $273,886 | $82,211 | $191,675 |
| 2018 | $3,125 | $268,516 | $80,599 | $187,917 |
| 2017 | $3,044 | $263,252 | $79,019 | $184,233 |
| 2016 | $2,805 | $258,092 | $77,470 | $180,622 |
| 2015 | $2,752 | $254,215 | $76,306 | $177,909 |
| 2014 | $2,799 | $249,237 | $74,812 | $174,425 |
Source: Public Records
Map
Nearby Homes
- 5390 Black Ave
- 1550 Calle Enrique
- 5041 Golden Rd
- 2321 Sandpiper Way
- 2531 Willowren Way
- 5995 Via Del Cielo
- 1834 Brooktree Way
- 1253 Ridgewood Rd
- 6056 Corte Encinas
- 5988 Corte Cerritos
- 6083 Corte Montanas
- 2589 Larrikeet Ct
- 1984 Brooktree Way
- 4563 Gatetree Cir
- 1927 Foxswallow Cir
- 4374 Valley Ave Unit D1
- 4428 Del Valle Pkwy
- 6686 Via San Blas
- 4267 Pleasanton Ave Unit C
- 6450 Calle Esperanza
- 5361 Black Ave Unit 2
- 5361 Black Ave Unit 4
- 5361 Black Ave Unit 3
- 5345 Black Ave Unit 1
- 5345 Black Ave Unit 2
- 5375 Black Ave Unit 4
- 5375 Black Ave Unit 3
- 5375 Black Ave Unit 2
- 5375 Black Ave Unit 1
- 5331 Black Ave Unit 2
- 5331 Black Ave Unit 1
- 5331 Black Ave Unit 4
- 5331 Black Ave Unit 3
- 5315 Black Ave Unit 1
- 5315 Black Ave Unit 2
- 5440 Black Ave
- 5391 Black Ave Unit 2
- 5391 Black Ave Unit 4
- 5391 Black Ave Unit 3
- 5400 Black Ave