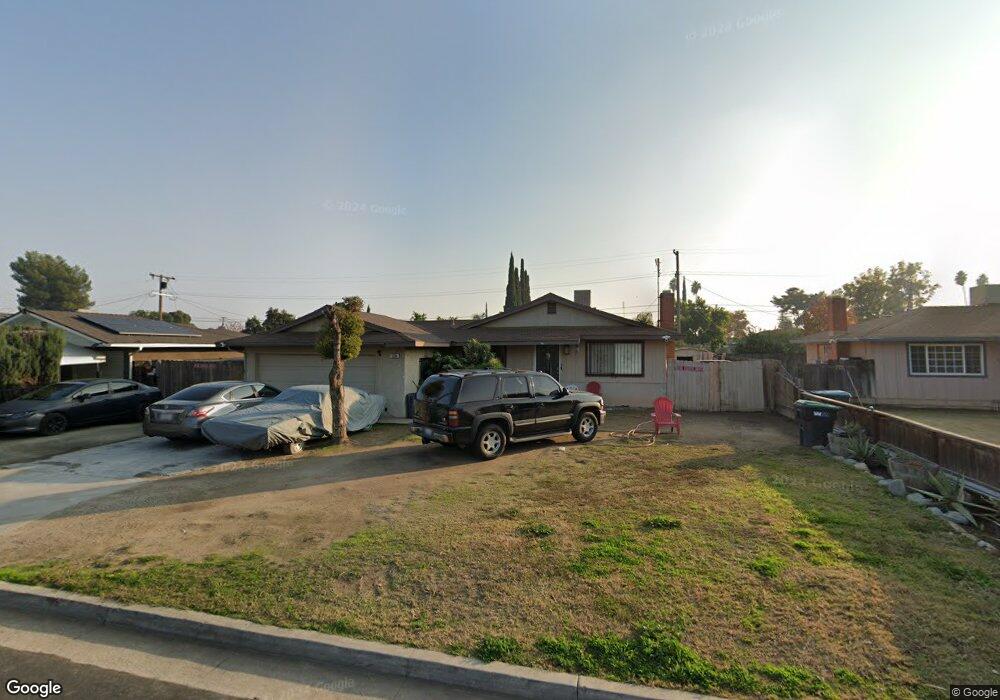
5364 E Tyler Ave Fresno, CA 93727
Roosevelt NeighborhoodEstimated Value: $282,371 - $329,000
3
Beds
2
Baths
1,120
Sq Ft
$265/Sq Ft
Est. Value
About This Home
This home is located at 5364 E Tyler Ave, Fresno, CA 93727 and is currently estimated at $297,343, approximately $265 per square foot. 5364 E Tyler Ave is a home located in Fresno County with nearby schools including Turner Elementary School, Scandinavian Middle School, and Mclane High School.
Ownership History
Date
Name
Owned For
Owner Type
Purchase Details
Closed on
Oct 22, 2009
Sold by
Arenas Angelica
Bought by
Jhs Family Limited Partnership
Current Estimated Value
Purchase Details
Closed on
Oct 5, 2005
Sold by
Arenas Felipe Dejesus
Bought by
Arenas Angelica
Home Financials for this Owner
Home Financials are based on the most recent Mortgage that was taken out on this home.
Original Mortgage
$51,000
Interest Rate
5.24%
Mortgage Type
Stand Alone Second
Purchase Details
Closed on
Sep 21, 2005
Sold by
Bouasaysy Oulay and Bouasaysy Outhit
Bought by
Arenas Angelica
Home Financials for this Owner
Home Financials are based on the most recent Mortgage that was taken out on this home.
Original Mortgage
$51,000
Interest Rate
5.24%
Mortgage Type
Stand Alone Second
Purchase Details
Closed on
Nov 16, 2001
Sold by
Bouasaysy Oulay
Bought by
Bouasaysy Oulay and Bouasaysy Outhit
Create a Home Valuation Report for This Property
The Home Valuation Report is an in-depth analysis detailing your home's value as well as a comparison with similar homes in the area
Home Values in the Area
Average Home Value in this Area
Purchase History
| Date | Buyer | Sale Price | Title Company |
|---|---|---|---|
| Jhs Family Limited Partnership | $50,500 | Accommodation | |
| Arenas Angelica | -- | Financial Title Company | |
| Arenas Angelica | $255,000 | Financial Title Company | |
| Bouasaysy Oulay | -- | -- |
Source: Public Records
Mortgage History
| Date | Status | Borrower | Loan Amount |
|---|---|---|---|
| Previous Owner | Arenas Angelica | $51,000 | |
| Previous Owner | Arenas Angelica | $204,000 |
Source: Public Records
Tax History Compared to Growth
Tax History
| Year | Tax Paid | Tax Assessment Tax Assessment Total Assessment is a certain percentage of the fair market value that is determined by local assessors to be the total taxable value of land and additions on the property. | Land | Improvement |
|---|---|---|---|---|
| 2025 | $1,000 | $79,824 | $38,623 | $41,201 |
| 2023 | $981 | $76,726 | $37,124 | $39,602 |
| 2022 | $968 | $75,223 | $36,397 | $38,826 |
| 2021 | $942 | $73,749 | $35,684 | $38,065 |
| 2020 | $938 | $72,994 | $35,319 | $37,675 |
| 2019 | $903 | $71,564 | $34,627 | $36,937 |
| 2018 | $884 | $70,162 | $33,949 | $36,213 |
| 2017 | $869 | $68,787 | $33,284 | $35,503 |
| 2016 | $840 | $67,439 | $32,632 | $34,807 |
| 2015 | $828 | $66,427 | $32,142 | $34,285 |
| 2014 | $823 | $65,127 | $31,513 | $33,614 |
Source: Public Records
Map
Nearby Homes
- 1336 N Homsy Ave
- 1221 N Peach Ave Unit 226
- 5181 E Olive Ave Unit 117
- 342 N Minnewawa Ave
- 5527 E Grant Ave
- 5576 E Belmont Ave
- 5150 E Pine Ave
- 5407 E Tulare St
- 5026 E Lewis Ave
- 6523 E Sooner Dr
- 5009 E Clay Ave
- 1353 N Adler Ave
- 1431 N Willow Ave
- 4983 E Grant Ave
- 851 N Filbert Ave
- 5771 E Belmont Ave
- 4942 E Oslin Ave
- 4923 E Grant Ave
- 605 N Winery Ave
- 5160 E Balch Ave
- 5358 E Tyler Ave
- 5370 E Tyler Ave
- 5365 E Lewis Ave
- 5359 E Lewis Ave
- 5371 E Lewis Ave
- 5352 E Tyler Ave
- 5376 E Tyler Ave
- 5361 E Tyler Ave
- 5353 E Lewis Ave
- 5377 E Lewis Ave
- 5367 E Tyler Ave
- 5355 E Tyler Ave
- 5382 E Tyler Ave
- 5346 E Tyler Ave
- 5373 E Tyler Ave
- 5349 E Tyler Ave
- 5347 E Lewis Ave
- 5383 E Lewis Ave
- 5379 E Tyler Ave
- 5343 E Tyler Ave