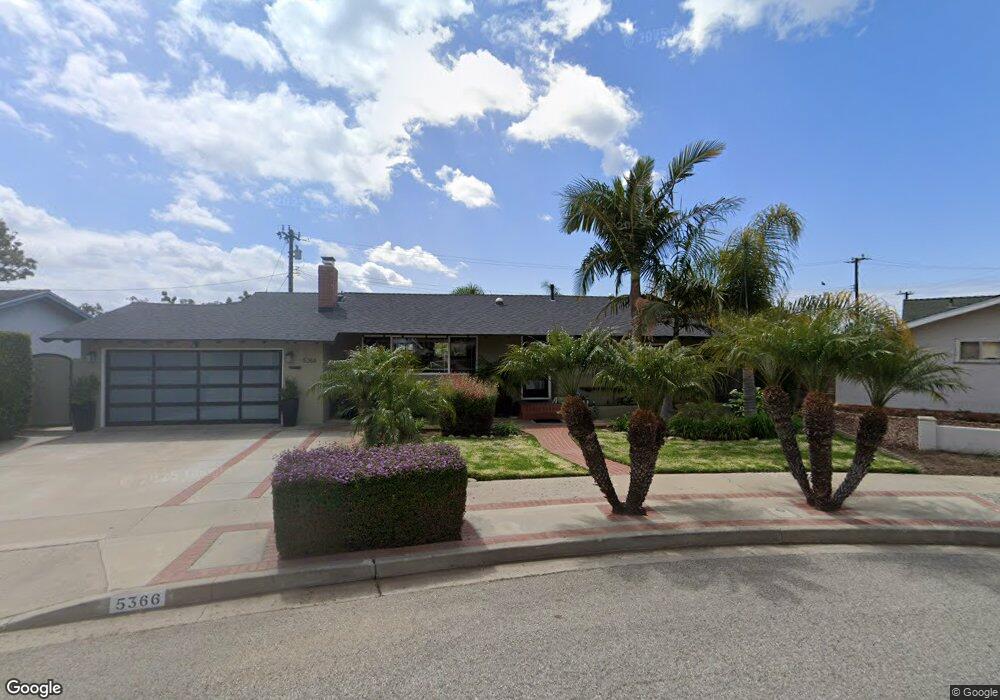
5366 Avon St Ventura, CA 93003
College NeighborhoodEstimated Value: $1,049,834 - $1,120,000
3
Beds
2
Baths
1,820
Sq Ft
$601/Sq Ft
Est. Value
About This Home
This home is located at 5366 Avon St, Ventura, CA 93003 and is currently estimated at $1,093,209, approximately $600 per square foot. 5366 Avon St is a home located in Ventura County with nearby schools including Poinsettia Elementary School, Anacapa Middle School, and Buena High School.
Ownership History
Date
Name
Owned For
Owner Type
Purchase Details
Closed on
Oct 9, 2012
Sold by
Dearana Karen Louise
Bought by
Modglin Don R and Modglin Arlinda L
Current Estimated Value
Home Financials for this Owner
Home Financials are based on the most recent Mortgage that was taken out on this home.
Original Mortgage
$403,750
Outstanding Balance
$278,528
Interest Rate
3.43%
Mortgage Type
New Conventional
Estimated Equity
$814,681
Purchase Details
Closed on
Jul 7, 2004
Sold by
Blackstock David S and Blackstock Elaine Dearana
Bought by
Dearana Karen Louise
Purchase Details
Closed on
Jun 20, 2003
Sold by
1031 Reverse Exchange Company Inc
Bought by
Blackstock David S and Blackstock Elaine Dearana
Purchase Details
Closed on
Mar 25, 2003
Sold by
Goode Catherine Suanne
Bought by
1031 Reverse Exchange Co Inc
Create a Home Valuation Report for This Property
The Home Valuation Report is an in-depth analysis detailing your home's value as well as a comparison with similar homes in the area
Home Values in the Area
Average Home Value in this Area
Purchase History
| Date | Buyer | Sale Price | Title Company |
|---|---|---|---|
| Modglin Don R | $425,000 | Fidelity National Title Co | |
| Dearana Karen Louise | -- | -- | |
| Blackstock David S | -- | -- | |
| 1031 Reverse Exchange Co Inc | $433,000 | First American Title Ins Co |
Source: Public Records
Mortgage History
| Date | Status | Borrower | Loan Amount |
|---|---|---|---|
| Open | Modglin Don R | $403,750 |
Source: Public Records
Tax History Compared to Growth
Tax History
| Year | Tax Paid | Tax Assessment Tax Assessment Total Assessment is a certain percentage of the fair market value that is determined by local assessors to be the total taxable value of land and additions on the property. | Land | Improvement |
|---|---|---|---|---|
| 2025 | $5,599 | $523,341 | $261,672 | $261,669 |
| 2024 | $5,599 | $513,080 | $256,541 | $256,539 |
| 2023 | $5,535 | $503,020 | $251,511 | $251,509 |
| 2022 | $5,145 | $493,157 | $246,579 | $246,578 |
| 2021 | $5,056 | $483,488 | $241,744 | $241,744 |
| 2020 | $5,009 | $478,532 | $239,266 | $239,266 |
| 2019 | $4,918 | $469,150 | $234,575 | $234,575 |
| 2018 | $4,834 | $459,952 | $229,976 | $229,976 |
| 2017 | $4,745 | $450,934 | $225,467 | $225,467 |
| 2016 | $4,661 | $442,094 | $221,047 | $221,047 |
| 2015 | $4,586 | $435,456 | $217,728 | $217,728 |
| 2014 | $4,521 | $426,928 | $213,464 | $213,464 |
Source: Public Records
Map
Nearby Homes
- 275 Fairfax Ave
- 288 Byron Ave
- 262 Crestwood Ave
- 412 Dayloma Ave
- 5633 Pembroke St
- 4797 Loma Vista Rd
- 572 Skyline Rd
- 5438 Rainier St
- 201 Xavier Ave
- 5535 Larkin St
- 6005 Sutter St
- 5365 Queens St
- 6174 Cobblestone Dr
- 6153 Cobblestone Dr
- 159 Donner Ave
- 146 Donner Ave
- 6019 Cloverly St
- 322 S Victoria Ave
- 91 Mount Whitney Ct
- 373 S Brookshire Ave
- 5382 Avon St
- 5353 Loma Vista Rd
- 5350 Avon St
- 5327 Loma Vista Rd
- 225 Fairfax Ave
- 5301 Loma Vista Rd
- 239 Arnett Ave
- 5367 Avon St
- 215 Fairfax Ave
- 5383 Avon St
- 5399 Loma Vista Rd
- 249 Arnett Ave
- 212 Teloma Dr
- 222 Teloma Dr
- 195 Stratford Ave
- 5399 Avon St
- 202 Teloma Dr
- 232 Teloma Dr
- 260 Arnett Ave
- 190 Teloma Dr