Estimated Value: $653,000 - $740,000
3
Beds
2
Baths
1,032
Sq Ft
$691/Sq Ft
Est. Value
About This Home
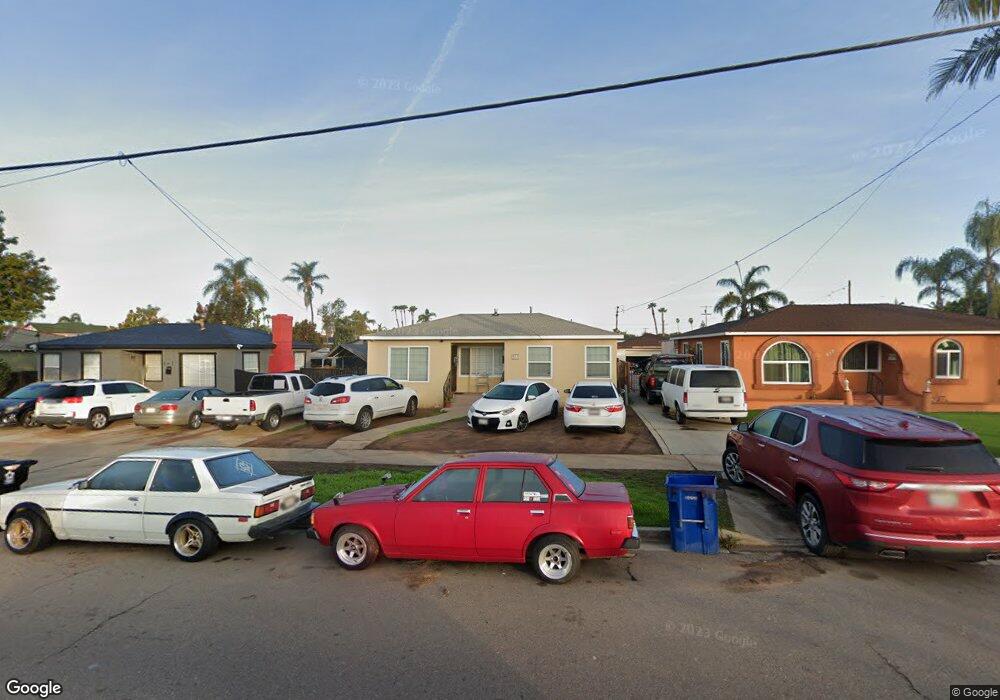
This home is located at 537 F St, Chula Vista, CA 91910 and is currently estimated at $712,917, approximately $690 per square foot. 537 F St is a home located in San Diego County with nearby schools including Vista Square Elementary School, Chula Vista Middle School, and Chula Vista High School.
Ownership History
Date
Name
Owned For
Owner Type
Purchase Details
Closed on
Apr 22, 2014
Sold by
Williams Eric
Bought by
Neumann Fritz and Neumann Betty
Current Estimated Value
Purchase Details
Closed on
Sep 9, 2008
Sold by
Williams Irene
Bought by
Williams Irene
Purchase Details
Closed on
May 26, 2004
Sold by
Kenworthy Edwin Howard
Bought by
Kenworthy Edwin Howard
Purchase Details
Closed on
Apr 2, 1999
Sold by
Washington Mutual Bank Fa
Bought by
Kenworthy Edwin H
Home Financials for this Owner
Home Financials are based on the most recent Mortgage that was taken out on this home.
Original Mortgage
$94,000
Interest Rate
3.95%
Mortgage Type
Seller Take Back
Purchase Details
Closed on
Nov 23, 1998
Sold by
Paz Antonio A and Paz Aurora C
Bought by
Washington Mutual Bank Fa
Purchase Details
Closed on
Jul 26, 1997
Sold by
Paz Antonio A and Paz Aurora C
Bought by
Zamora Ramon
Purchase Details
Closed on
Oct 25, 1990
Purchase Details
Closed on
Jun 11, 1990
Create a Home Valuation Report for This Property
The Home Valuation Report is an in-depth analysis detailing your home's value as well as a comparison with similar homes in the area
Home Values in the Area
Average Home Value in this Area
Purchase History
| Date | Buyer | Sale Price | Title Company |
|---|---|---|---|
| Neumann Fritz | $315,000 | First American Title Company | |
| Williams Irene | -- | None Available | |
| Kenworthy Edwin Howard | -- | -- | |
| Kenworthy Edwin H | $117,500 | Chicago Title Co | |
| Washington Mutual Bank Fa | $110,000 | First American Title Ins Co | |
| Zamora Ramon | -- | First American Title Co | |
| -- | $135,000 | -- | |
| -- | $118,000 | -- |
Source: Public Records
Mortgage History
| Date | Status | Borrower | Loan Amount |
|---|---|---|---|
| Previous Owner | Kenworthy Edwin H | $94,000 |
Source: Public Records
Tax History Compared to Growth
Tax History
| Year | Tax Paid | Tax Assessment Tax Assessment Total Assessment is a certain percentage of the fair market value that is determined by local assessors to be the total taxable value of land and additions on the property. | Land | Improvement |
|---|---|---|---|---|
| 2025 | $4,459 | $386,133 | $245,166 | $140,967 |
| 2024 | $4,459 | $378,562 | $240,359 | $138,203 |
| 2023 | $4,398 | $371,141 | $235,647 | $135,494 |
| 2022 | $4,272 | $363,865 | $231,027 | $132,838 |
| 2021 | $4,174 | $356,732 | $226,498 | $130,234 |
| 2020 | $4,074 | $353,075 | $224,176 | $128,899 |
| 2019 | $3,969 | $346,153 | $219,781 | $126,372 |
| 2018 | $3,908 | $339,367 | $215,472 | $123,895 |
| 2017 | $10 | $332,714 | $211,248 | $121,466 |
| 2016 | $3,737 | $326,191 | $207,106 | $119,085 |
| 2015 | $3,684 | $321,293 | $203,996 | $117,297 |
| 2014 | $2,813 | $251,000 | $159,000 | $92,000 |
Source: Public Records
Map
Nearby Homes
- 468 Davidson St
- 462 Davidson St
- 456 Davidson St
- 536 Park Way Unit 41,42
- 677 G St Unit 161
- 677 G St Unit 103.5
- 677 G St Unit 51
- 376 Center St Unit 304
- 134-38 5th Ave
- 141 Brightwood Ave
- 691 G St
- 120 Madison Ave
- 731 G St Unit SPC E10
- 429 Woodlawn Ave Unit D
- 465 Fourth Ave Unit 17
- 465 Fourth Ave Unit 14
- 490 Fourth Ave Unit 21
- 54-58 Smith Ave
- 475 4th Ave Unit H
- 471 4th Ave Unit B