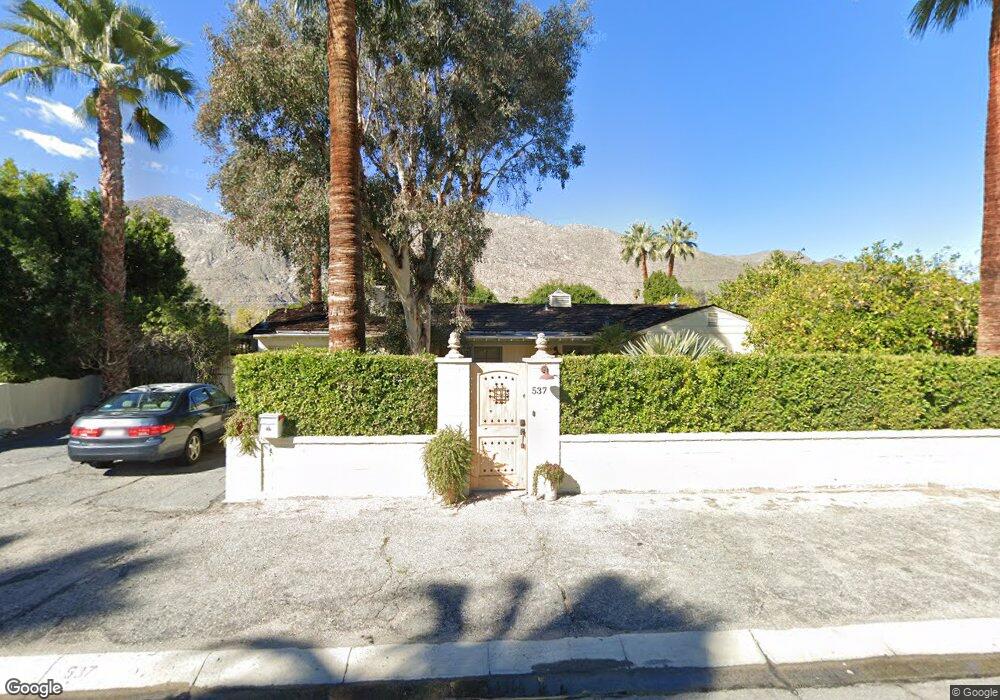
537 S Indian Trail Palm Springs, CA 92264
Warm Sands NeighborhoodEstimated Value: $809,000 - $1,182,000
3
Beds
3
Baths
1,956
Sq Ft
$531/Sq Ft
Est. Value
About This Home
This home is located at 537 S Indian Trail, Palm Springs, CA 92264 and is currently estimated at $1,039,225, approximately $531 per square foot. 537 S Indian Trail is a home located in Riverside County with nearby schools including Cahuilla Elementary School, Raymond Cree Middle School, and Palm Springs High School.
Ownership History
Date
Name
Owned For
Owner Type
Purchase Details
Closed on
Dec 27, 2011
Sold by
Klein Rolando and Klein Linda
Bought by
Klein Rolando and Klein Linda
Current Estimated Value
Home Financials for this Owner
Home Financials are based on the most recent Mortgage that was taken out on this home.
Original Mortgage
$285,000
Outstanding Balance
$32,673
Interest Rate
3.94%
Mortgage Type
New Conventional
Estimated Equity
$1,006,552
Purchase Details
Closed on
Apr 1, 2011
Sold by
Jones Cleve
Bought by
Klein Rolando and Klein Linda
Purchase Details
Closed on
Jul 8, 1999
Sold by
Bozzetto Dino & Maureen M Trustees
Bought by
Jones Cleve
Home Financials for this Owner
Home Financials are based on the most recent Mortgage that was taken out on this home.
Original Mortgage
$132,000
Interest Rate
7.56%
Mortgage Type
Purchase Money Mortgage
Purchase Details
Closed on
Nov 28, 1995
Sold by
Bozzetto Maureen M and Miller Maureen
Bought by
Bozzetto Dino and Bozzetto Maureen M
Create a Home Valuation Report for This Property
The Home Valuation Report is an in-depth analysis detailing your home's value as well as a comparison with similar homes in the area
Home Values in the Area
Average Home Value in this Area
Purchase History
| Date | Buyer | Sale Price | Title Company |
|---|---|---|---|
| Klein Rolando | -- | None Available | |
| Klein Rolando | -- | Orange Coast Title Co | |
| Klein Rolando | $380,000 | Orange Coast Title Co | |
| Jones Cleve | $165,000 | Orange Coast Title Co | |
| Bozzetto Dino | -- | -- |
Source: Public Records
Mortgage History
| Date | Status | Borrower | Loan Amount |
|---|---|---|---|
| Open | Klein Rolando | $285,000 | |
| Previous Owner | Jones Cleve | $132,000 |
Source: Public Records
Tax History Compared to Growth
Tax History
| Year | Tax Paid | Tax Assessment Tax Assessment Total Assessment is a certain percentage of the fair market value that is determined by local assessors to be the total taxable value of land and additions on the property. | Land | Improvement |
|---|---|---|---|---|
| 2025 | $5,986 | $486,832 | $121,703 | $365,129 |
| 2023 | $5,986 | $467,929 | $116,978 | $350,951 |
| 2022 | $6,101 | $458,755 | $114,685 | $344,070 |
| 2021 | $5,978 | $449,761 | $112,437 | $337,324 |
| 2020 | $5,713 | $445,151 | $111,285 | $333,866 |
| 2019 | $5,614 | $436,423 | $109,103 | $327,320 |
| 2018 | $5,509 | $427,866 | $106,964 | $320,902 |
| 2017 | $5,427 | $419,477 | $104,867 | $314,610 |
| 2016 | $5,268 | $411,253 | $102,811 | $308,442 |
| 2015 | $5,055 | $405,078 | $101,268 | $303,810 |
| 2014 | $4,990 | $397,144 | $99,285 | $297,859 |
Source: Public Records
Map
Nearby Homes
- 550 S Indian Trail
- 764 Ramon Rd
- 776 Ramon Rd
- 523 S Vista Oro
- 583 S Calle Abronia
- 562 Ramon Rd
- 435 Tan Oak Dr
- 419 Tan Oak Dr
- 463 Ramon Rd
- 455 Ramon Rd
- 461 Ramon Rd
- 449 Ramon Rd
- 443 Ramon Rd
- 839 Ramon Rd
- 427 Ramon Rd
- 487 Village Square W
- 859 Ramon Rd
- 467 S Calle el Segundo Unit D20
- 467 S Calle el Segundo Unit D5
- 467 S Calle el Segundo Unit D3
- 527 S Indian Trail
- 555 S Indian Trail
- 536 S Calle Palo Fierro
- 550 S Calle Palo Fierro
- 546 S Calle Palo Fierro
- 556 S Calle Palo Fierro
- 526 S Calle Palo Fierro
- 505 S Indian Trail
- 560 S Calle Palo Fierro
- 571 S Indian Trail
- 538 S Indian Trail
- 508 S Calle Palo Fierro
- 504 S Indian Trail
- 568 S Indian Trail
- 537 S Calle Palo Fierro
- 545 S Calle Palo Fierro
- 557 S Calle Palo Fierro
- 742 Ramon Rd Unit 742
- 532 Indian Trail
- 725 Ramon Rd