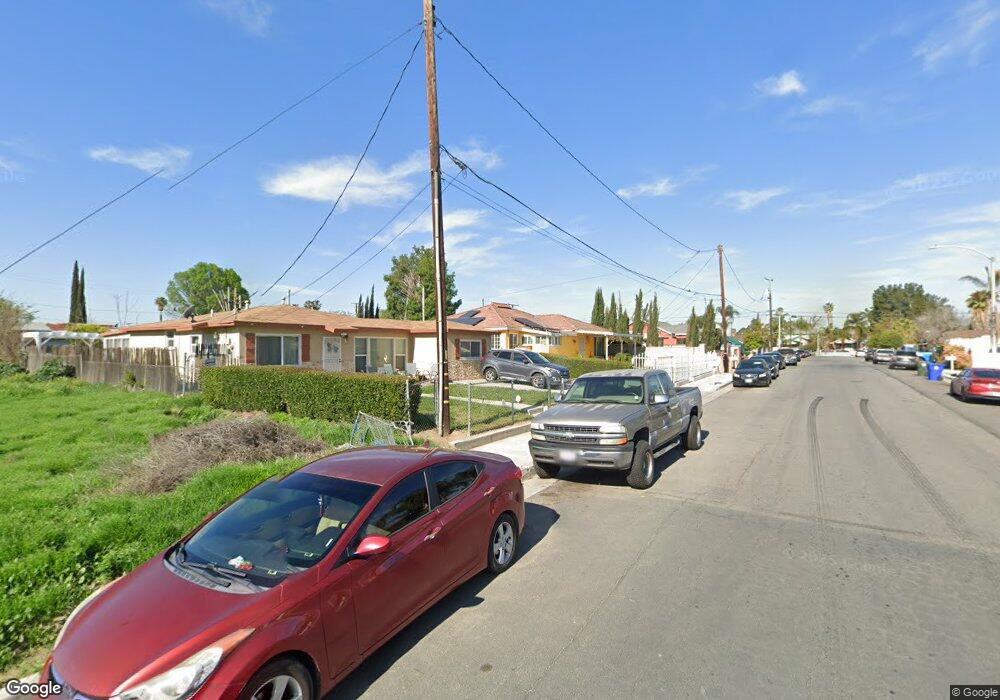
5370 Capary Rd Riverside, CA 92509
Rubidoux NeighborhoodEstimated Value: $449,318 - $512,000
4
Beds
2
Baths
2,054
Sq Ft
$230/Sq Ft
Est. Value
About This Home
This home is located at 5370 Capary Rd, Riverside, CA 92509 and is currently estimated at $473,080, approximately $230 per square foot. 5370 Capary Rd is a home located in Riverside County with nearby schools including Peralta Elementary, Mission Middle School, and Rubidoux High School.
Ownership History
Date
Name
Owned For
Owner Type
Purchase Details
Closed on
Jul 14, 2025
Sold by
Elenes Araujo Lourdes and Avilez Rivas Sergio
Bought by
Araujo Lourdes Elenes and Revoc Sergio
Current Estimated Value
Purchase Details
Closed on
May 13, 2013
Sold by
Munoz Ruth Gapio
Bought by
Araujo Lourdes Elenes and Rivas Sergio Leobardo Avilez
Home Financials for this Owner
Home Financials are based on the most recent Mortgage that was taken out on this home.
Original Mortgage
$50,000
Interest Rate
3.38%
Mortgage Type
Seller Take Back
Purchase Details
Closed on
Jan 24, 2013
Sold by
Munoz Joe
Bought by
Munoz Ruth Gapio
Purchase Details
Closed on
Jul 28, 2010
Sold by
Johnson Garth Elden
Bought by
Harris Ellen L
Purchase Details
Closed on
May 6, 2008
Sold by
Johnson Garth Elden
Bought by
Harris Ellen
Purchase Details
Closed on
Mar 14, 1997
Sold by
Edith Blum Mary
Bought by
Blum Mary Edith
Create a Home Valuation Report for This Property
The Home Valuation Report is an in-depth analysis detailing your home's value as well as a comparison with similar homes in the area
Home Values in the Area
Average Home Value in this Area
Purchase History
| Date | Buyer | Sale Price | Title Company |
|---|---|---|---|
| Araujo Lourdes Elenes | -- | None Listed On Document | |
| Araujo Lourdes Elenes | $150,000 | Nations Title Company | |
| Munoz Ruth Gapio | -- | Nations Title Company | |
| Munoz Ruth Gapio | $60,000 | Nations Title Company | |
| Harris Ellen L | -- | None Available | |
| Harris Ellen | -- | None Available | |
| Blum Mary Edith | -- | -- |
Source: Public Records
Mortgage History
| Date | Status | Borrower | Loan Amount |
|---|---|---|---|
| Previous Owner | Araujo Lourdes Elenes | $50,000 |
Source: Public Records
Tax History
| Year | Tax Paid | Tax Assessment Tax Assessment Total Assessment is a certain percentage of the fair market value that is determined by local assessors to be the total taxable value of land and additions on the property. | Land | Improvement |
|---|---|---|---|---|
| 2025 | $3,501 | $318,911 | $67,720 | $251,191 |
| 2023 | $3,501 | $306,530 | $65,092 | $241,438 |
| 2022 | $2,029 | $174,050 | $63,816 | $110,234 |
| 2021 | $2,020 | $170,638 | $62,565 | $108,073 |
| 2020 | $1,986 | $168,889 | $61,924 | $106,965 |
| 2019 | $1,946 | $165,578 | $60,710 | $104,868 |
| 2018 | $1,884 | $162,332 | $59,521 | $102,811 |
| 2017 | $1,864 | $159,150 | $58,354 | $100,796 |
| 2016 | $1,838 | $156,030 | $57,210 | $98,820 |
| 2015 | $1,813 | $153,688 | $56,351 | $97,337 |
| 2014 | $1,693 | $150,680 | $55,249 | $95,431 |
Source: Public Records
Map
Nearby Homes
- 3825 Crestmore Rd Unit 414
- 3825 Crestmore Rd Unit 494
- 3825 Crestmore Rd Unit 378
- 3825 Crestmore Rd Unit 475
- 3825 Crestmore Rd Unit 480
- 5442 Mission Blvd
- 3895 Twining St
- 5184 Westerfield St
- 3747 Mintern St
- 0 Odell St
- 3830 Crestmore Rd Unit 503
- 5342 36th St
- 5315 Wenatchee Way
- 3934 Pontiac Ave
- 5479 34th St
- 0 Mission Blvd Unit IG25268475
- 0 Mission Blvd Unit PW25275749
- 0 Mission Blvd Unit IV23139894
- 5748 Tilton Ave
- 5754 Tilton Ave
- 5366 Capary Rd
- 5374 Capary Rd
- 5380 Capary Rd
- 5384 Capary Rd
- 5371 Carol Way
- 5367 Carol Way
- 5377 Carol Way
- 5361 Carol Way
- 5381 Carol Way
- 5367 Capary Rd
- 5357 Capary Rd
- 5375 Capary Rd
- 5387 Carol Way
- 5381 Capary Rd
- 5345 Capary Rd
- 5385 Capary Rd
- 4026 Wallace St
- 4006 Wallace St
- 4036 Wallace St
- 5335 Capary Rd
Your Personal Tour Guide
Ask me questions while you tour the home.