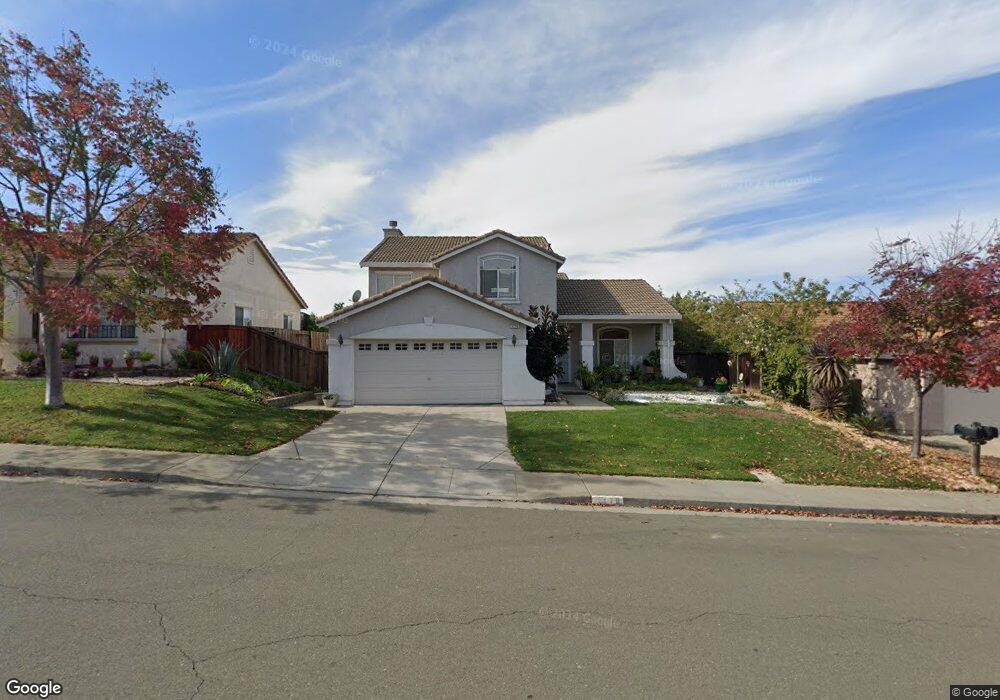
5379 Chenin Blanc Place Vallejo, CA 94591
Northgate NeighborhoodEstimated Value: $710,106 - $821,000
4
Beds
3
Baths
2,250
Sq Ft
$331/Sq Ft
Est. Value
About This Home
This home is located at 5379 Chenin Blanc Place, Vallejo, CA 94591 and is currently estimated at $745,277, approximately $331 per square foot. 5379 Chenin Blanc Place is a home located in Solano County with nearby schools including Joseph H. Wardlaw Elementary School, Hogan Middle School, and Jesse M. Bethel High School.
Ownership History
Date
Name
Owned For
Owner Type
Purchase Details
Closed on
Jul 20, 2022
Sold by
Ann Barbosa Jo
Bought by
Jo Ann Barbosa Revocable Trust
Current Estimated Value
Purchase Details
Closed on
Sep 14, 2006
Sold by
Barbosa Jo Ann
Bought by
Barbosa Jo Ann
Home Financials for this Owner
Home Financials are based on the most recent Mortgage that was taken out on this home.
Original Mortgage
$453,100
Interest Rate
6.51%
Mortgage Type
New Conventional
Purchase Details
Closed on
Oct 15, 1999
Sold by
The Forecast Group Lp
Bought by
Barbosa Jo Ann
Home Financials for this Owner
Home Financials are based on the most recent Mortgage that was taken out on this home.
Original Mortgage
$232,110
Interest Rate
7.82%
Create a Home Valuation Report for This Property
The Home Valuation Report is an in-depth analysis detailing your home's value as well as a comparison with similar homes in the area
Home Values in the Area
Average Home Value in this Area
Purchase History
| Date | Buyer | Sale Price | Title Company |
|---|---|---|---|
| Jo Ann Barbosa Revocable Trust | -- | -- | |
| Barbosa Jo Ann | -- | Transnation Title Southland | |
| Barbosa Jo Ann | $266,500 | United Independent Title Co |
Source: Public Records
Mortgage History
| Date | Status | Borrower | Loan Amount |
|---|---|---|---|
| Previous Owner | Barbosa Jo Ann | $453,100 | |
| Previous Owner | Barbosa Jo Ann | $232,110 |
Source: Public Records
Tax History Compared to Growth
Tax History
| Year | Tax Paid | Tax Assessment Tax Assessment Total Assessment is a certain percentage of the fair market value that is determined by local assessors to be the total taxable value of land and additions on the property. | Land | Improvement |
|---|---|---|---|---|
| 2025 | $6,909 | $411,453 | $122,955 | $288,498 |
| 2024 | $6,909 | $403,387 | $120,545 | $282,842 |
| 2023 | $6,606 | $395,479 | $118,182 | $277,297 |
| 2022 | $6,520 | $387,725 | $115,865 | $271,860 |
| 2021 | $9,555 | $380,124 | $113,594 | $266,530 |
| 2020 | $9,590 | $376,228 | $112,430 | $263,798 |
| 2019 | $9,444 | $368,852 | $110,226 | $258,626 |
| 2018 | $5,979 | $361,620 | $108,065 | $253,555 |
| 2017 | $5,772 | $354,531 | $105,947 | $248,584 |
| 2016 | $5,203 | $347,580 | $103,870 | $243,710 |
| 2015 | $5,150 | $342,360 | $102,310 | $240,050 |
| 2014 | $5,088 | $335,654 | $100,306 | $235,348 |
Source: Public Records
Map
Nearby Homes
- 6461 Eagle Ridge Dr
- 6320 Pebble Beach Dr
- 5109 Zinfandel Ln
- 6206 Pebble Beach Dr
- 3554 Calm Breeze Ct
- 1233 Symphony Way
- 1211 Symphony Way
- 1224 Sonata Dr
- 1146 Waltz Ct
- 2011 Agate Ct
- 2139 Garnet Cir
- 9216 Hallmark Place
- 1 Saint Johns Mine Rd
- 1218 Locust Dr
- 367 Darley Dr
- 9272 Hallmark Place
- 108 Hilltop Dr
- 373 Clydesdale Dr
- 559 Topley Ct
- 1290 Rachel Way
- 5375 Chenin Blanc Place
- 5381 Chenin Blanc Place
- 5383 Chenin Blanc Place
- 5373 Chenin Blanc Place
- 5600 Blush Ct Unit 9
- 5540 Burgundy Ct
- 5536 Burgundy Ct
- 5385 Chenin Blanc Place
- 5544 Burgundy Ct
- 5371 Chenin Blanc Place
- 5532 Burgundy Ct
- 5374 Chenin Blanc Place
- 5530 Burgundy Ct
- 5601 Blush Ct
- 5620 Blush Ct
- 5548 Burgundy Ct
- 5370 Chenin Blanc Place
- 5367 Chenin Blanc Place
- 5621 Blush Ct
- 5552 Burgundy Ct