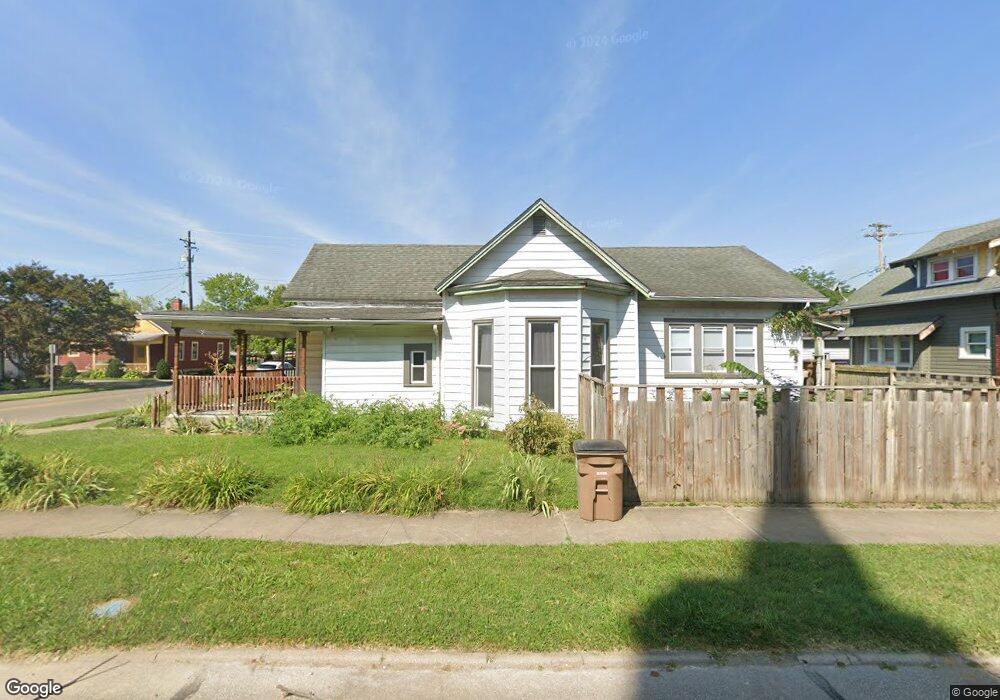
538 8th St Columbus, IN 47201
Estimated Value: $215,212 - $277,000
2
Beds
2
Baths
1,375
Sq Ft
$181/Sq Ft
Est. Value
About This Home
This home is located at 538 8th St, Columbus, IN 47201 and is currently estimated at $249,053, approximately $181 per square foot. 538 8th St is a home located in Bartholomew County with nearby schools including Lillian Schmitt Elementary School, Central Middle School, and Columbus North High School.
Ownership History
Date
Name
Owned For
Owner Type
Purchase Details
Closed on
Oct 27, 2021
Sold by
Boneshaker Rentals 2Nd
Bought by
Boneshaker Rentals Llc
Current Estimated Value
Purchase Details
Closed on
Oct 17, 2019
Sold by
Battin Matthew and Rose Melissa
Bought by
Boneshaker Rentals 2Nd
Purchase Details
Closed on
Sep 6, 2017
Sold by
Denton Scotty W
Bought by
Matthew and Melissa
Purchase Details
Closed on
Feb 24, 2000
Sold by
Alfonso Turone
Bought by
Denton Scoty W and Denton Waltraud E
Create a Home Valuation Report for This Property
The Home Valuation Report is an in-depth analysis detailing your home's value as well as a comparison with similar homes in the area
Home Values in the Area
Average Home Value in this Area
Purchase History
| Date | Buyer | Sale Price | Title Company |
|---|---|---|---|
| Boneshaker Rentals Llc | -- | None Available | |
| Boneshaker Rentals 2Nd | -- | -- | |
| Matthew | $112,000 | -- | |
| Battin Matthew | $112,000 | Security Title Services Llc | |
| Denton Scoty W | $74,300 | -- |
Source: Public Records
Tax History Compared to Growth
Tax History
| Year | Tax Paid | Tax Assessment Tax Assessment Total Assessment is a certain percentage of the fair market value that is determined by local assessors to be the total taxable value of land and additions on the property. | Land | Improvement |
|---|---|---|---|---|
| 2024 | $4,965 | $220,800 | $33,000 | $187,800 |
| 2023 | $5,365 | $236,300 | $38,400 | $197,900 |
| 2022 | $5,299 | $234,100 | $38,400 | $195,700 |
| 2021 | $4,734 | $207,600 | $13,900 | $193,700 |
| 2020 | $4,406 | $193,600 | $13,900 | $179,700 |
| 2019 | $2,580 | $121,200 | $13,900 | $107,300 |
| 2018 | $2,876 | $116,400 | $13,900 | $102,500 |
| 2017 | $2,942 | $135,100 | $14,500 | $120,600 |
| 2016 | $2,951 | $135,100 | $14,500 | $120,600 |
| 2014 | $2,945 | $132,500 | $14,500 | $118,000 |
Source: Public Records
Map
Nearby Homes
- 818 Sycamore St
- 810 7th St
- 410 6th St Unit 202
- 822 7th St
- 1103 Pearl St
- 1132 Chestnut St
- 930 Union St
- 1117 California St
- 1210 California St
- 1310 California St
- 1439 Pearl St
- 319 15th St
- 1115 Grand Ave
- 1620 Lafayette Ave
- 1534 Lawton Ave
- 851 Werner Ave
- 1010 16th St
- 620 Hutchins Ave
- 1712 Franklin St
- 1210 16th St