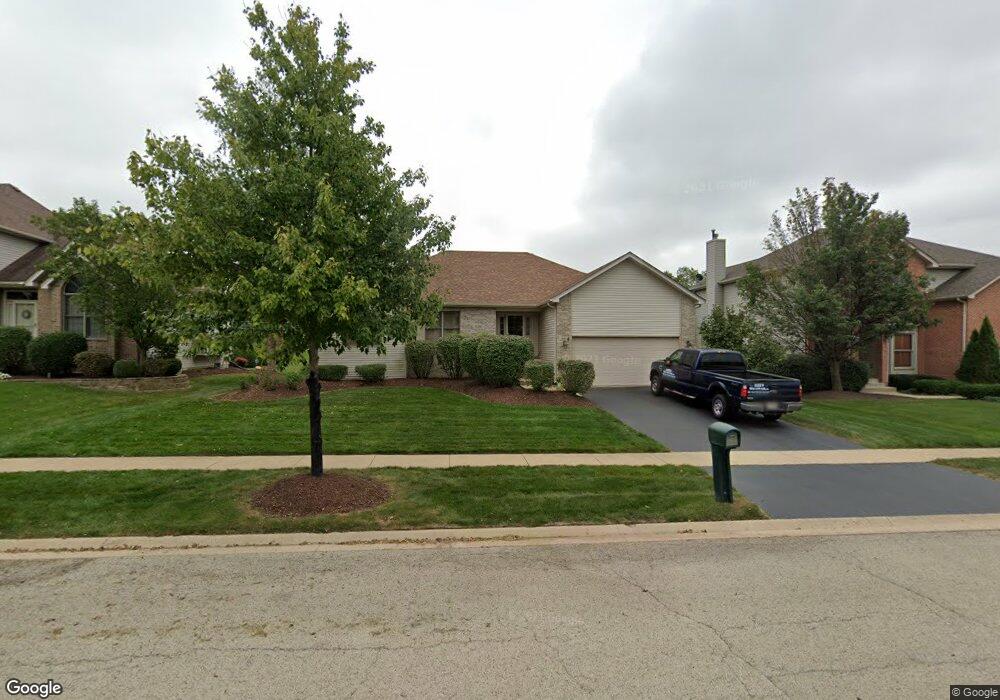
538 Danbury Dr Unit 2 Oswego, IL 60543
South Oswego NeighborhoodEstimated Value: $426,591 - $451,000
4
Beds
3
Baths
1,800
Sq Ft
$245/Sq Ft
Est. Value
About This Home
This home is located at 538 Danbury Dr Unit 2, Oswego, IL 60543 and is currently estimated at $441,648, approximately $245 per square foot. 538 Danbury Dr Unit 2 is a home located in Kendall County with nearby schools including Prairie Point Elementary School, Traughber Junior High School, and Oswego High School.
Ownership History
Date
Name
Owned For
Owner Type
Purchase Details
Closed on
Dec 11, 2014
Sold by
Morelli Alex J and Morelli Johana
Bought by
Morelli Alex J and Morelli Johana
Current Estimated Value
Home Financials for this Owner
Home Financials are based on the most recent Mortgage that was taken out on this home.
Original Mortgage
$217,000
Outstanding Balance
$172,526
Interest Rate
4.99%
Mortgage Type
New Conventional
Estimated Equity
$269,122
Purchase Details
Closed on
Aug 30, 2001
Sold by
T J Baumgartner Custom Homes Corp
Bought by
Morelli Alex J
Home Financials for this Owner
Home Financials are based on the most recent Mortgage that was taken out on this home.
Original Mortgage
$179,700
Interest Rate
7.03%
Purchase Details
Closed on
Mar 28, 2001
Sold by
Deerpath Development Corp
Bought by
T J Baumgartner Custom Homes Corp
Create a Home Valuation Report for This Property
The Home Valuation Report is an in-depth analysis detailing your home's value as well as a comparison with similar homes in the area
Home Values in the Area
Average Home Value in this Area
Purchase History
| Date | Buyer | Sale Price | Title Company |
|---|---|---|---|
| Morelli Alex J | -- | Servicelink | |
| Morelli Alex J | $225,000 | Chicago Title Insurance Co | |
| T J Baumgartner Custom Homes Corp | $97,500 | Chicago Title Insurance Co |
Source: Public Records
Mortgage History
| Date | Status | Borrower | Loan Amount |
|---|---|---|---|
| Open | Morelli Alex J | $217,000 | |
| Closed | Morelli Alex J | $179,700 |
Source: Public Records
Tax History Compared to Growth
Tax History
| Year | Tax Paid | Tax Assessment Tax Assessment Total Assessment is a certain percentage of the fair market value that is determined by local assessors to be the total taxable value of land and additions on the property. | Land | Improvement |
|---|---|---|---|---|
| 2024 | $9,405 | $122,866 | $28,486 | $94,380 |
| 2023 | $8,385 | $108,731 | $25,209 | $83,522 |
| 2022 | $8,385 | $98,846 | $22,917 | $75,929 |
| 2021 | $8,084 | $92,380 | $21,418 | $70,962 |
| 2020 | $7,992 | $90,569 | $20,998 | $69,571 |
| 2019 | $7,801 | $87,256 | $20,998 | $66,258 |
| 2018 | $8,336 | $91,359 | $18,948 | $72,411 |
| 2017 | $8,139 | $85,382 | $17,708 | $67,674 |
| 2016 | $7,998 | $82,895 | $17,192 | $65,703 |
| 2015 | $8,211 | $81,270 | $16,855 | $64,415 |
| 2014 | -- | $78,903 | $16,364 | $62,539 |
| 2013 | -- | $78,903 | $16,364 | $62,539 |
Source: Public Records
Map
Nearby Homes
- 315 White Pines Ln
- 483 Deerfield Dr
- 406 Windsor Dr
- 482 Deerfield Dr
- 716 Pinehurst Ln
- 714 Pinehurst Ln
- 668 Cumberland Ln
- 676 Cumberland Ln
- 673 Cumberland Ln
- 851 Claridge Dr
- 770 Dartmouth Ln
- 538 Sudbury Cir
- 639 Vista Dr
- 777 Dartmouth Ln
- 609 Chestnut Dr
- 395 Danforth Dr
- 616 Briarwood Ln
- 210 Dorset Ave
- 94 Templeton Dr
- 80 Stonehill Rd
- 540 Danbury Dr
- 536 Danbury Dr
- 456 Windsor Dr Unit 2
- 534 Danbury Dr Unit 4
- 454 Windsor Dr
- 537 Danbury Dr
- 535 Danbury Dr
- 532 Danbury Dr
- 461 Windsor Dr
- 463 Windsor Dr
- 452 Windsor Dr Unit 2
- 459 Windsor Dr
- 533 Danbury Dr
- 457 Windsor Dr Unit 2
- 455 Windsor Dr
- 539 Danbury Dr
- 530 Danbury Dr
- 453 Windsor Dr
- 541 Danbury Dr
- 243 Isleview Dr