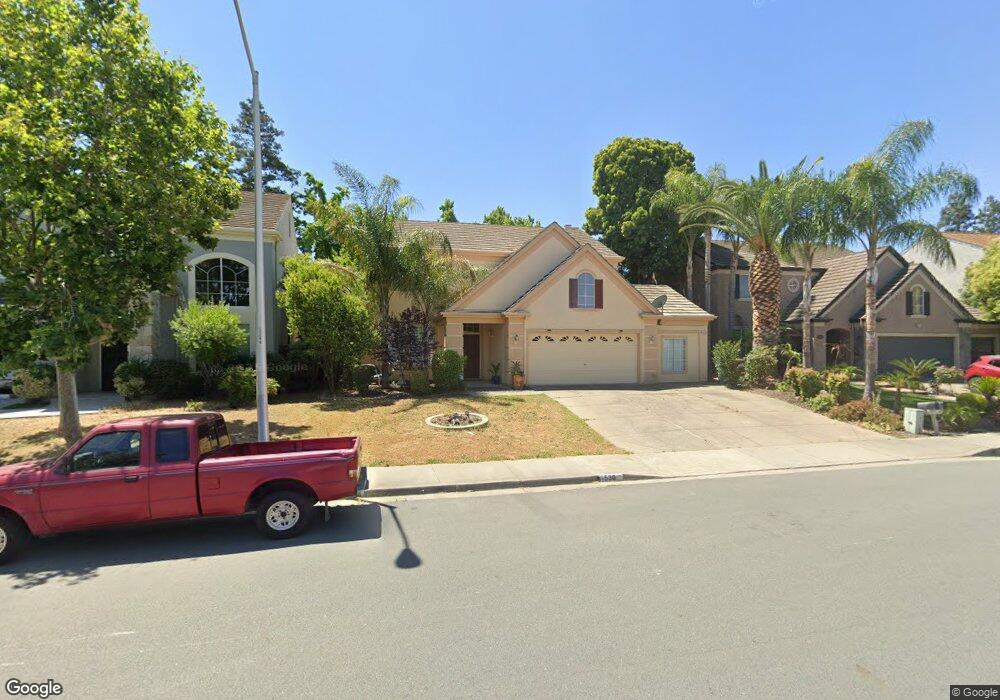
538 Eaker Way Antioch, CA 94509
Deer Valley NeighborhoodEstimated Value: $625,000 - $697,000
3
Beds
3
Baths
2,206
Sq Ft
$294/Sq Ft
Est. Value
About This Home
This home is located at 538 Eaker Way, Antioch, CA 94509 and is currently estimated at $648,357, approximately $293 per square foot. 538 Eaker Way is a home located in Contra Costa County with nearby schools including Belshaw Elementary School, Park Middle School, and Antioch High School.
Ownership History
Date
Name
Owned For
Owner Type
Purchase Details
Closed on
Apr 16, 2004
Sold by
Mandani Ana Gawronska
Bought by
Madani Jason
Current Estimated Value
Home Financials for this Owner
Home Financials are based on the most recent Mortgage that was taken out on this home.
Original Mortgage
$345,600
Outstanding Balance
$152,252
Interest Rate
4.75%
Mortgage Type
Purchase Money Mortgage
Estimated Equity
$496,105
Purchase Details
Closed on
Feb 7, 2001
Sold by
Piscitelli Francis James and Piscitelli Sally Mary
Bought by
Piscitelli Francis James and Piscitelli Sally Mary
Purchase Details
Closed on
Aug 9, 1994
Sold by
Pulte Home Corp
Bought by
Piscitelli Frank J and Piscitelli Sally M
Home Financials for this Owner
Home Financials are based on the most recent Mortgage that was taken out on this home.
Original Mortgage
$105,000
Interest Rate
8.73%
Mortgage Type
Purchase Money Mortgage
Create a Home Valuation Report for This Property
The Home Valuation Report is an in-depth analysis detailing your home's value as well as a comparison with similar homes in the area
Home Values in the Area
Average Home Value in this Area
Purchase History
| Date | Buyer | Sale Price | Title Company |
|---|---|---|---|
| Madani Jason | -- | Ticor Title Company | |
| Madani Jason | $432,000 | Ticor Title Company | |
| Piscitelli Francis James | -- | -- | |
| Piscitelli Francis James | -- | -- | |
| Piscitelli Frank J | $215,500 | First American Title Guarant |
Source: Public Records
Mortgage History
| Date | Status | Borrower | Loan Amount |
|---|---|---|---|
| Open | Madani Jason | $345,600 | |
| Previous Owner | Piscitelli Frank J | $105,000 | |
| Closed | Madani Jason | $64,800 |
Source: Public Records
Tax History
| Year | Tax Paid | Tax Assessment Tax Assessment Total Assessment is a certain percentage of the fair market value that is determined by local assessors to be the total taxable value of land and additions on the property. | Land | Improvement |
|---|---|---|---|---|
| 2025 | $6,968 | $614,197 | $213,261 | $400,936 |
| 2024 | $6,562 | $602,155 | $209,080 | $393,075 |
| 2023 | $6,562 | $590,349 | $204,981 | $385,368 |
| 2022 | $6,456 | $578,774 | $200,962 | $377,812 |
| 2021 | $5,887 | $531,000 | $184,374 | $346,626 |
| 2019 | $5,300 | $471,000 | $163,541 | $307,459 |
| 2018 | $5,037 | $456,000 | $158,333 | $297,667 |
| 2017 | $4,646 | $419,000 | $145,486 | $273,514 |
| 2016 | $4,141 | $372,500 | $129,340 | $243,160 |
| 2015 | $3,978 | $325,000 | $112,847 | $212,153 |
| 2014 | $4,528 | $276,000 | $95,833 | $180,167 |
Source: Public Records
Map
Nearby Homes
- 3162 Westbourne Dr
- 3419 Barmouth Dr
- 3405 Garrow Dr
- 924 Halite Way
- 224 Cobblestone Dr
- 1009 Flintrock Dr
- 941 Bluerock Dr
- 620 Lynn Ave
- 2942 Roosevelt Ln
- 2936 Roosevelt Ln
- 2814 Harris Dr
- 1512 Mellissa Ct
- 26 El Capitan Ln
- 2901 Roosevelt Ln
- 14 El Capitan Ln
- 9 El Capitan Ln
- 4100 Diorite Ct
- 4110 Bramante Ct
- 321 Brennan Ct
- 2451 Carpinteria Dr
- 534 Eaker Way
- 542 Eaker Way
- 621 Doolittle Way
- 617 Doolittle Way
- 530 Eaker Way
- 600 Eaker Way
- 627 Doolittle Way
- 613 Doolittle Way
- 537 Eaker Way
- 631 Doolittle Way
- 526 Eaker Way
- 604 Eaker Way
- 533 Eaker Way
- 609 Doolittle Way
- 601 Eaker Way
- 529 Eaker Way
- 635 Doolittle Way
- 522 Eaker Way
- 605 Doolittle Way
- 608 Eaker Way
Your Personal Tour Guide
Ask me questions while you tour the home.