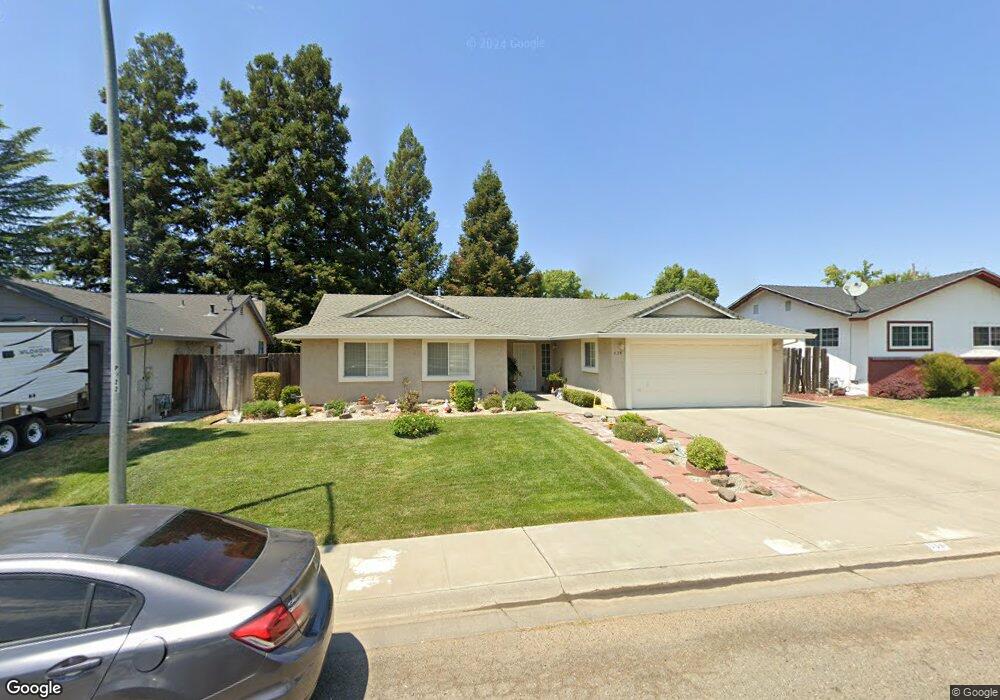
538 Hyland Dr Corning, CA 96021
Estimated Value: $270,000 - $370,000
3
Beds
2
Baths
1,445
Sq Ft
$211/Sq Ft
Est. Value
About This Home
This home is located at 538 Hyland Dr, Corning, CA 96021 and is currently estimated at $305,145, approximately $211 per square foot. 538 Hyland Dr is a home located in Tehama County with nearby schools including Olive View Elementary School, Maywood Middle School, and Corning High School.
Ownership History
Date
Name
Owned For
Owner Type
Purchase Details
Closed on
May 31, 2014
Sold by
Marino Marlene P
Bought by
Marino Marlene P
Current Estimated Value
Create a Home Valuation Report for This Property
The Home Valuation Report is an in-depth analysis detailing your home's value as well as a comparison with similar homes in the area
Purchase History
| Date | Buyer | Sale Price | Title Company |
|---|---|---|---|
| Marino Marlene P | -- | None Available |
Source: Public Records
Tax History
| Year | Tax Paid | Tax Assessment Tax Assessment Total Assessment is a certain percentage of the fair market value that is determined by local assessors to be the total taxable value of land and additions on the property. | Land | Improvement |
|---|---|---|---|---|
| 2025 | $1,872 | $188,523 | $49,820 | $138,703 |
| 2023 | $1,835 | $181,205 | $47,887 | $133,318 |
| 2022 | $1,808 | $177,653 | $46,949 | $130,704 |
| 2021 | $1,739 | $174,171 | $46,029 | $128,142 |
| 2020 | $1,757 | $172,387 | $45,558 | $126,829 |
| 2019 | $1,684 | $169,008 | $44,665 | $124,343 |
| 2018 | $1,685 | $165,695 | $43,790 | $121,905 |
| 2017 | $1,672 | $162,447 | $42,932 | $119,515 |
| 2016 | $1,557 | $159,263 | $42,091 | $117,172 |
| 2015 | $1,548 | $156,871 | $41,459 | $115,412 |
| 2014 | $1,519 | $153,799 | $40,647 | $113,152 |
Source: Public Records
Map
Nearby Homes
- 542 Hyland Dr
- 526 Hyland Dr
- 537 Stanmar Dr
- 541 Stanmar Dr
- 525 Stanmar Dr
- 554 Hyland Dr
- 537 Hyland Dr
- 525 Hyland Dr
- 553 Stanmar Dr
- 541 Hyland Dr
- 0 Stanmar Dr Unit TC201040323
- 0 Stanmar Dr Unit 201140698
- 570 Hyland Dr
- 565 Stanmar Dr
- 490 Hyland Dr
- 538 Stanmar Dr
- 526 Marguerite Ave
- 310 Divisidero Ave
- 491 Stanmar Dr
- 542 Stanmar Dr
Your Personal Tour Guide
Ask me questions while you tour the home.