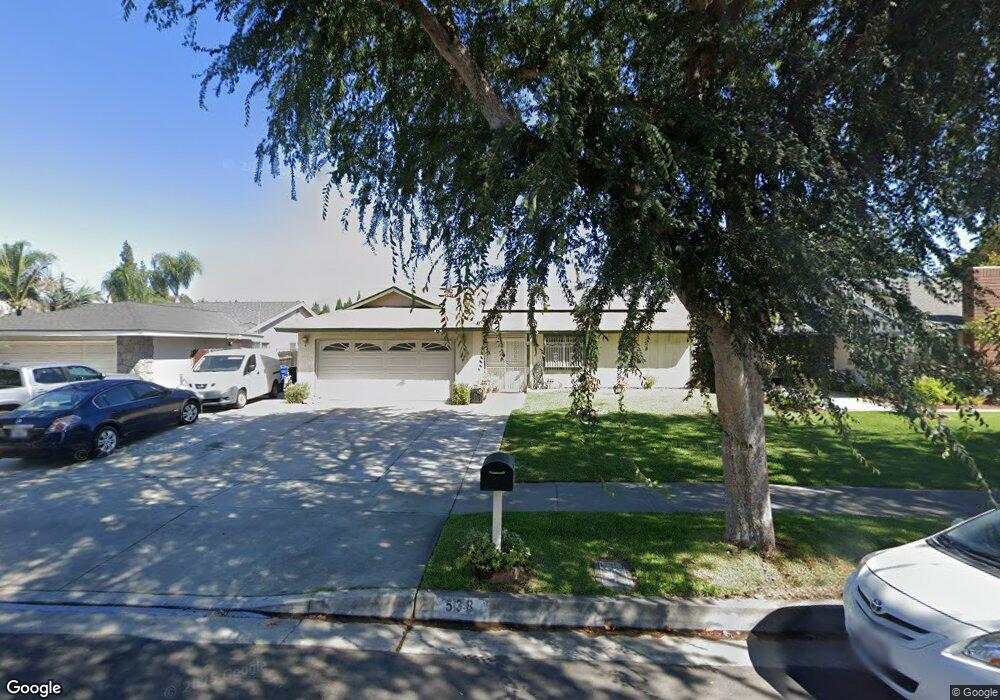
538 W Elm St Ontario, CA 91762
Downtown Ontario NeighborhoodEstimated Value: $696,036 - $760,000
3
Beds
2
Baths
1,500
Sq Ft
$485/Sq Ft
Est. Value
About This Home
This home is located at 538 W Elm St, Ontario, CA 91762 and is currently estimated at $726,759, approximately $484 per square foot. 538 W Elm St is a home located in San Bernardino County with nearby schools including Richard Haynes Elementary, Oaks Middle, and Ontario High School.
Ownership History
Date
Name
Owned For
Owner Type
Purchase Details
Closed on
Jul 26, 2016
Sold by
Gomez Enriqueta Ramirez and Ramirez Enriqueta
Bought by
Gomez Enriqueta Ramirez and The Enriqueta Ramirez Gomez 20
Current Estimated Value
Purchase Details
Closed on
Feb 27, 2003
Sold by
Malbrough Bobby J
Bought by
Farlow Gregory and Farlow Tona
Home Financials for this Owner
Home Financials are based on the most recent Mortgage that was taken out on this home.
Original Mortgage
$203,300
Interest Rate
5.82%
Purchase Details
Closed on
Feb 13, 2003
Sold by
Farlow Gregory and Farlow Tona
Bought by
Ramirez Enriqueta
Home Financials for this Owner
Home Financials are based on the most recent Mortgage that was taken out on this home.
Original Mortgage
$203,300
Interest Rate
5.82%
Purchase Details
Closed on
Aug 3, 2001
Sold by
Farlow Evar
Bought by
Farlow Gregory and Farlow Tona
Purchase Details
Closed on
Dec 12, 2000
Sold by
Farlow Malbrough Eva B and Farlow Eva B
Bought by
Malbrough Bobby J and Farlow Malbrough Eva B
Home Financials for this Owner
Home Financials are based on the most recent Mortgage that was taken out on this home.
Original Mortgage
$32,000
Interest Rate
7.08%
Mortgage Type
Stand Alone Second
Create a Home Valuation Report for This Property
The Home Valuation Report is an in-depth analysis detailing your home's value as well as a comparison with similar homes in the area
Home Values in the Area
Average Home Value in this Area
Purchase History
| Date | Buyer | Sale Price | Title Company |
|---|---|---|---|
| Gomez Enriqueta Ramirez | -- | None Available | |
| Farlow Gregory | -- | First American | |
| Ramirez Enriqueta | $214,000 | First American | |
| Farlow Gregory | -- | -- | |
| Malbrough Bobby J | -- | -- |
Source: Public Records
Mortgage History
| Date | Status | Borrower | Loan Amount |
|---|---|---|---|
| Closed | Ramirez Enriqueta | $203,300 | |
| Previous Owner | Malbrough Bobby J | $32,000 |
Source: Public Records
Tax History Compared to Growth
Tax History
| Year | Tax Paid | Tax Assessment Tax Assessment Total Assessment is a certain percentage of the fair market value that is determined by local assessors to be the total taxable value of land and additions on the property. | Land | Improvement |
|---|---|---|---|---|
| 2025 | $3,329 | $309,949 | $115,870 | $194,079 |
| 2024 | $3,329 | $303,872 | $113,598 | $190,274 |
| 2023 | $3,236 | $297,914 | $111,371 | $186,543 |
| 2022 | $3,192 | $292,072 | $109,187 | $182,885 |
| 2021 | $3,172 | $286,345 | $107,046 | $179,299 |
| 2020 | $3,116 | $283,409 | $105,948 | $177,461 |
| 2019 | $3,089 | $277,852 | $103,871 | $173,981 |
| 2018 | $3,046 | $272,404 | $101,834 | $170,570 |
| 2017 | $9,289 | $267,062 | $99,837 | $167,225 |
| 2016 | $9,145 | $261,825 | $97,879 | $163,946 |
| 2015 | $9,135 | $257,892 | $96,409 | $161,483 |
| 2014 | $2,717 | $252,840 | $94,520 | $158,320 |
Source: Public Records
Map
Nearby Homes
- 1546 Redwood Ave
- 559 W Belmont St
- 4251 S Grasly Paseo
- 653 W Belmont St
- 550 W Belmont St
- 1420 S Euclid Ave Unit A & B
- 646 W Belmont St
- 1620 S Cypress Ave
- 754 W Belmont St
- 1214 S Cypress Ave Unit G
- 1216 S Cypress Ave Unit E
- 1849 S San Antonio Ave
- 410 W Maitland St
- 1031 S Palmetto Ave
- 1031 S Palmetto Ave Unit N9
- 1031 S Palmetto Ave Unit W8
- 1031 S Palmetto Ave Unit II3
- 1031 S Palmetto Ave Unit N1
- 1209 S Palmetto Ave Unit C
- 1949 S Palm Place