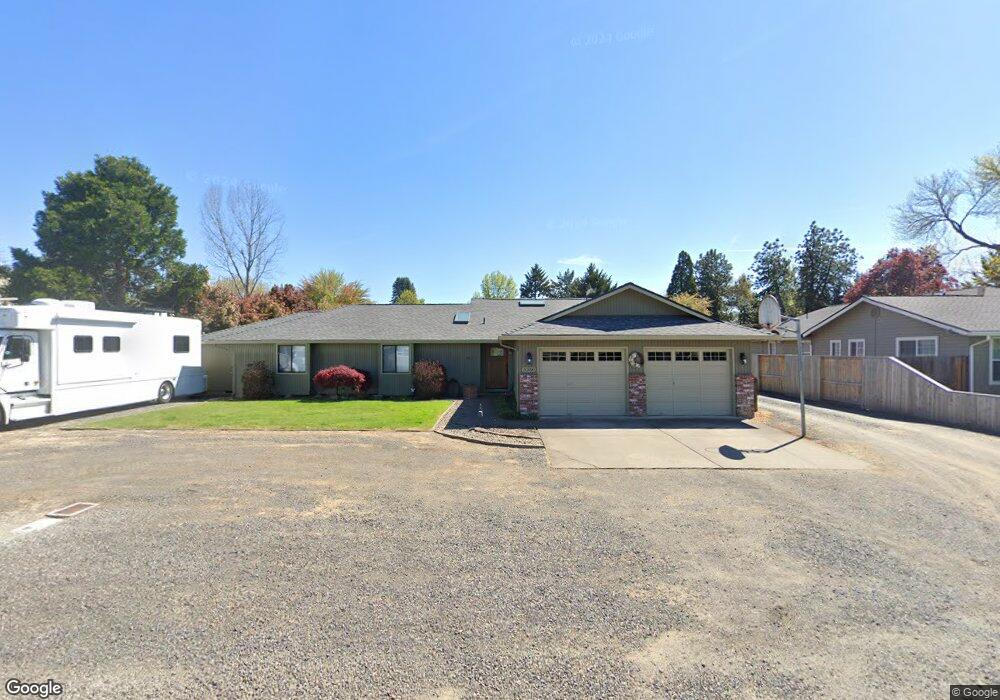
5380 Raymond Way Central Point, OR 97502
Estimated Value: $570,656 - $643,000
4
Beds
3
Baths
2,031
Sq Ft
$304/Sq Ft
Est. Value
About This Home
This home is located at 5380 Raymond Way, Central Point, OR 97502 and is currently estimated at $617,414, approximately $303 per square foot. 5380 Raymond Way is a home located in Jackson County with nearby schools including Jewett Elementary School, Scenic Middle School, and Crater High School.
Ownership History
Date
Name
Owned For
Owner Type
Purchase Details
Closed on
Jan 10, 2005
Sold by
Rodgers Tamara L
Bought by
Rodgers Matthew A and Rodgers Tamara L
Current Estimated Value
Home Financials for this Owner
Home Financials are based on the most recent Mortgage that was taken out on this home.
Original Mortgage
$307,000
Outstanding Balance
$151,328
Interest Rate
5.7%
Mortgage Type
New Conventional
Estimated Equity
$466,086
Purchase Details
Closed on
Jun 28, 2004
Sold by
Rodgers Matthew A
Bought by
Rodgers Matthew A and Rodgers Tamara L
Purchase Details
Closed on
Feb 3, 2004
Sold by
Gray Michael L and Gray Tammy R
Bought by
Rodgers Matthew A
Home Financials for this Owner
Home Financials are based on the most recent Mortgage that was taken out on this home.
Original Mortgage
$294,500
Interest Rate
5.8%
Mortgage Type
Unknown
Create a Home Valuation Report for This Property
The Home Valuation Report is an in-depth analysis detailing your home's value as well as a comparison with similar homes in the area
Purchase History
We collect this data history from publicly available records. To have your information removed, we recommend requesting removal directly through your county’s website.
| Date | Buyer | Sale Price | Title Company |
|---|---|---|---|
| Rodgers Matthew A | -- | Lawyers Title Ins | |
| Rodgers Tamara L | -- | Lawyers Title Ins | |
| Rodgers Matthew A | -- | -- | |
| Rodgers Matthew A | $310,000 | Lawyers Title Insurance Corp |
Source: Public Records
Mortgage History
We collect this data history from publicly available records. To have your information removed, we recommend requesting removal directly through your county’s website.
| Date | Status | Borrower | Loan Amount |
|---|---|---|---|
| Open | Rodgers Tamara L | $307,000 | |
| Closed | Rodgers Matthew A | $294,500 |
Source: Public Records
Tax History
| Year | Tax Paid | Tax Assessment Tax Assessment Total Assessment is a certain percentage of the fair market value that is determined by local assessors to be the total taxable value of land and additions on the property. | Land | Improvement |
|---|---|---|---|---|
| 2026 | $6,269 | $378,810 | -- | -- |
| 2025 | $6,115 | $367,780 | $121,320 | $246,460 |
| 2024 | $6,115 | $357,070 | $117,780 | $239,290 |
| 2023 | $5,918 | $346,670 | $114,350 | $232,320 |
| 2022 | $5,780 | $346,670 | $114,350 | $232,320 |
| 2021 | $5,615 | $336,580 | $111,020 | $225,560 |
| 2020 | $5,152 | $308,840 | $107,780 | $201,060 |
| 2019 | $5,025 | $291,120 | $101,590 | $189,530 |
| 2018 | $4,871 | $282,650 | $98,630 | $184,020 |
| 2017 | $4,749 | $282,650 | $98,630 | $184,020 |
| 2016 | $4,265 | $246,490 | $92,960 | $153,530 |
| 2015 | $4,087 | $246,490 | $92,960 | $153,530 |
| 2014 | $3,983 | $232,350 | $87,630 | $144,720 |
Source: Public Records
Map
Nearby Homes
- 4093 Old Upton Rd
- 4065 Crestwood Cir
- 1860 Cottonwood Dr
- 106 Victoria Way
- 356 Marian Ave Unit 40
- 252 Jena Ct Unit 1
- 4626 N Pacific Hwy
- 0 Peninger Rd
- 409 Castle Rock Dr
- 1726 River Run St
- 829 Hazel St
- 1502 River Run St
- 0 Boulder Ridge St
- 55 Crater Ln
- 0 N 3rd St
- 2653 Scenic Ave
- 545 Bridge Creek Dr
- 1099 N Haskell St
- 625 Cherry St
- 342 Hazel St
- 5358 Raymond Way
- 2037 Boes Ave
- 5375 Raymond Way
- 5336 Raymond Way
- 5397 Raymond Way
- 5359 Raymond Way
- 2027 Boes Ave
- 5337 Raymond Way
- 2089 Boes Ave
- 0 Boes Ave
- 1997 Boes Ave
- 5320 Raymond Way
- 5365 Teresa Way
- 5351 Teresa Way
- 5395 Teresa Way
- 5329 Raymond Way
- 5325 Teresa Way Unit 1
- 5325 Teresa Way
- 2056 Boes Ave
- 5296 Raymond Way
Your Personal Tour Guide
Ask me questions while you tour the home.