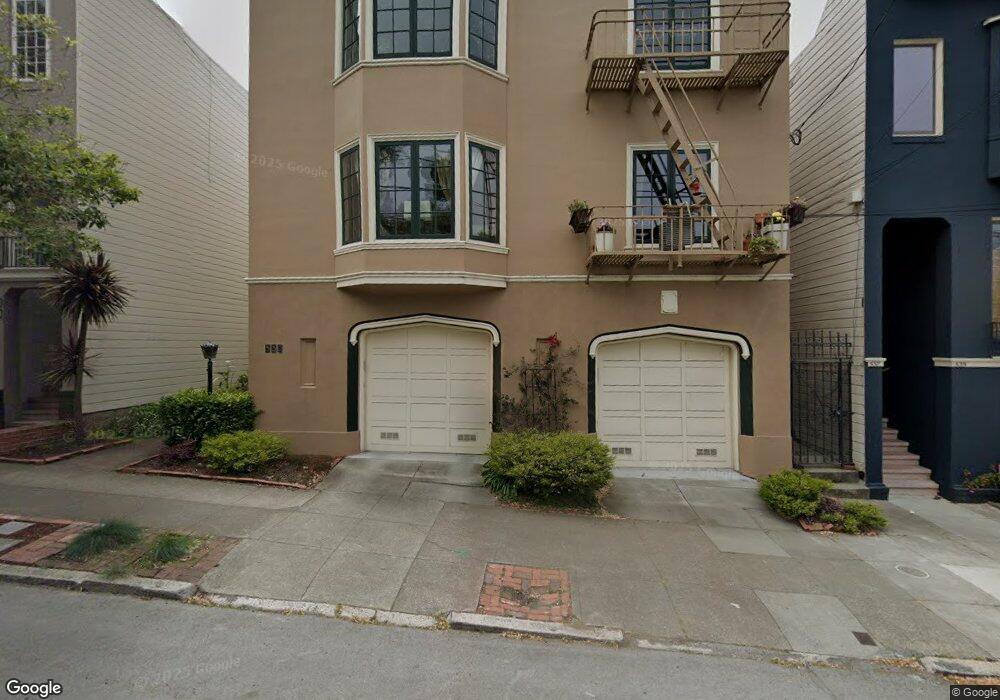
539 14th Ave Unit 4 San Francisco, CA 94118
Central Richmond NeighborhoodEstimated Value: $1,189,000 - $1,303,088
2
Beds
1
Bath
1,150
Sq Ft
$1,098/Sq Ft
Est. Value
About This Home
This home is located at 539 14th Ave Unit 4, San Francisco, CA 94118 and is currently estimated at $1,263,022, approximately $1,098 per square foot. 539 14th Ave Unit 4 is a home located in San Francisco County with nearby schools including Argonne Elementary School, Presidio Middle School, and Stratford School - San Francisco 14th Avenue.
Ownership History
Date
Name
Owned For
Owner Type
Purchase Details
Closed on
May 16, 2006
Sold by
Headington Geoffrey C
Bought by
Levinger Walter
Current Estimated Value
Home Financials for this Owner
Home Financials are based on the most recent Mortgage that was taken out on this home.
Original Mortgage
$510,000
Outstanding Balance
$296,383
Interest Rate
6.46%
Mortgage Type
Fannie Mae Freddie Mac
Estimated Equity
$966,639
Purchase Details
Closed on
Jan 23, 2002
Sold by
Dippe Mark
Bought by
Headington Geoffrey C
Home Financials for this Owner
Home Financials are based on the most recent Mortgage that was taken out on this home.
Original Mortgage
$334,400
Interest Rate
6.25%
Purchase Details
Closed on
Jan 16, 2002
Sold by
Stephens Terry and Dippe Mark
Bought by
Dippe Mark
Home Financials for this Owner
Home Financials are based on the most recent Mortgage that was taken out on this home.
Original Mortgage
$334,400
Interest Rate
6.25%
Create a Home Valuation Report for This Property
The Home Valuation Report is an in-depth analysis detailing your home's value as well as a comparison with similar homes in the area
Home Values in the Area
Average Home Value in this Area
Purchase History
| Date | Buyer | Sale Price | Title Company |
|---|---|---|---|
| Levinger Walter | $785,000 | Fidelity National Title Co | |
| Headington Geoffrey C | $418,000 | First American Title Co | |
| Dippe Mark | -- | First American Title Ins Co |
Source: Public Records
Mortgage History
| Date | Status | Borrower | Loan Amount |
|---|---|---|---|
| Open | Levinger Walter | $510,000 | |
| Previous Owner | Headington Geoffrey C | $334,400 |
Source: Public Records
Tax History
| Year | Tax Paid | Tax Assessment Tax Assessment Total Assessment is a certain percentage of the fair market value that is determined by local assessors to be the total taxable value of land and additions on the property. | Land | Improvement |
|---|---|---|---|---|
| 2025 | $13,156 | $1,072,756 | $536,378 | $536,378 |
| 2024 | $13,156 | $1,051,722 | $525,861 | $525,861 |
| 2023 | $12,920 | $1,031,100 | $515,550 | $515,550 |
| 2022 | $12,657 | $1,010,884 | $505,442 | $505,442 |
| 2021 | $12,432 | $991,064 | $495,532 | $495,532 |
| 2020 | $12,493 | $980,902 | $490,451 | $490,451 |
| 2019 | $12,068 | $961,670 | $480,835 | $480,835 |
| 2018 | $11,663 | $942,814 | $471,407 | $471,407 |
| 2017 | $11,227 | $924,328 | $462,164 | $462,164 |
| 2016 | $11,037 | $906,204 | $453,102 | $453,102 |
| 2015 | $10,900 | $892,592 | $446,296 | $446,296 |
| 2014 | $9,145 | $750,000 | $450,000 | $300,000 |
Source: Public Records
Map
Nearby Homes
- 1124 Balboa St
- 531 16th Ave
- 428 17th Ave
- 554 18th Ave
- 456 11th Ave Unit 456
- 456 11th Ave
- 458 11th Ave Unit 458
- 700 12th Ave Unit 4
- 700 12th Ave Unit A
- 333 14th Ave
- 660 10th Ave Unit 660
- 674 10th Ave
- 1533 Clement St
- 4138-4140 Fulton St
- 1721 Clement St
- 558-560 Balboa St
- 607 6th Ave
- 772 8th Ave Unit 1
- 263-265 8th Ave
- 167-169 11th Ave
- 539 14th Ave Unit 3
- 539 14th Ave Unit 1
- 539 14th Ave Unit 2
- 535 14th Ave
- 549 14th Ave Unit 549
- 547 14th Ave
- 551 14th Ave Unit 553
- 531 14th Ave Unit 533
- 555 14th Ave Unit 557
- 523 14th Ave
- 527 14th Ave Unit 529
- 559 14th Ave Unit 561
- 525 14th Ave
- 561 14th Ave
- 563 14th Ave Unit 565
- 519 14th Ave Unit 521
- 515 14th Ave Unit 517
- 567 14th Ave Unit 569
- 540 15th Ave
- 532 15th Ave Unit 534
Your Personal Tour Guide
Ask me questions while you tour the home.