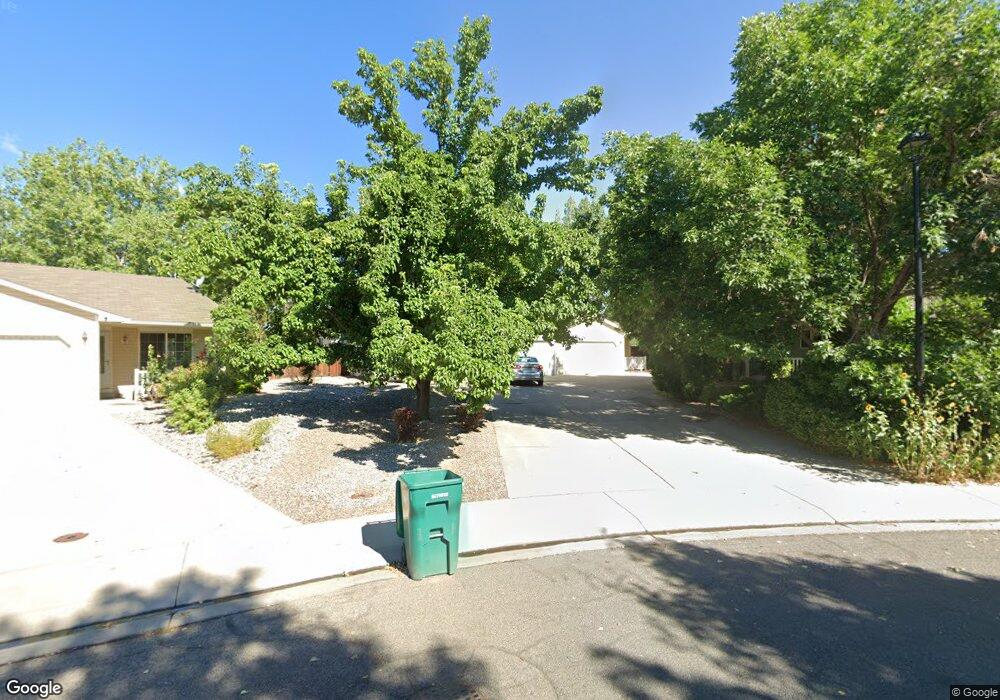
539 29 3/8 Rd Unit B Grand Junction, CO 81504
Northeast Grand Junction NeighborhoodEstimated Value: $290,012 - $299,000
3
Beds
2
Baths
1,034
Sq Ft
$285/Sq Ft
Est. Value
About This Home
This home is located at 539 29 3/8 Rd Unit B, Grand Junction, CO 81504 and is currently estimated at $294,753, approximately $285 per square foot. 539 29 3/8 Rd Unit B is a home located in Mesa County with nearby schools including Nisley Elementary School, Bookcliff Middle School, and Central High School.
Ownership History
Date
Name
Owned For
Owner Type
Purchase Details
Closed on
Feb 28, 2007
Sold by
Beasley Robert S
Bought by
Woodpecker Llc
Current Estimated Value
Home Financials for this Owner
Home Financials are based on the most recent Mortgage that was taken out on this home.
Original Mortgage
$110,250
Outstanding Balance
$66,620
Interest Rate
6.32%
Mortgage Type
Purchase Money Mortgage
Estimated Equity
$228,133
Purchase Details
Closed on
Feb 20, 2007
Sold by
Wallace Frances
Bought by
Beasley Robert S
Home Financials for this Owner
Home Financials are based on the most recent Mortgage that was taken out on this home.
Original Mortgage
$110,250
Outstanding Balance
$66,620
Interest Rate
6.32%
Mortgage Type
Purchase Money Mortgage
Estimated Equity
$228,133
Purchase Details
Closed on
May 3, 2006
Sold by
Fagan Diana M
Bought by
B Miller Family Trust
Purchase Details
Closed on
Sep 8, 1999
Sold by
Sonshine Construction Development Llc
Bought by
Lee Homes Inc
Purchase Details
Closed on
Aug 16, 1999
Sold by
Lee Homes Inc
Bought by
Fagan Diana M
Create a Home Valuation Report for This Property
The Home Valuation Report is an in-depth analysis detailing your home's value as well as a comparison with similar homes in the area
Home Values in the Area
Average Home Value in this Area
Purchase History
| Date | Buyer | Sale Price | Title Company |
|---|---|---|---|
| Woodpecker Llc | -- | Accommodation | |
| Beasley Robert S | $157,500 | Fahtco | |
| B Miller Family Trust | $143,900 | Fahtco | |
| Lee Homes Inc | -- | -- | |
| Fagan Diana M | $79,999 | -- |
Source: Public Records
Mortgage History
| Date | Status | Borrower | Loan Amount |
|---|---|---|---|
| Open | Beasley Robert S | $110,250 |
Source: Public Records
Tax History Compared to Growth
Tax History
| Year | Tax Paid | Tax Assessment Tax Assessment Total Assessment is a certain percentage of the fair market value that is determined by local assessors to be the total taxable value of land and additions on the property. | Land | Improvement |
|---|---|---|---|---|
| 2024 | $923 | $12,760 | -- | $12,760 |
| 2023 | $923 | $12,760 | $0 | $12,760 |
| 2022 | $883 | $11,970 | $0 | $11,970 |
| 2021 | $861 | $12,320 | $0 | $12,320 |
| 2020 | $766 | $11,220 | $0 | $11,220 |
| 2019 | $698 | $11,220 | $0 | $11,220 |
| 2018 | $638 | $9,220 | $0 | $9,220 |
| 2017 | $636 | $9,220 | $0 | $9,220 |
| 2016 | $609 | $9,950 | $0 | $9,950 |
| 2015 | $613 | $9,950 | $0 | $9,950 |
| 2014 | $631 | $10,260 | $0 | $10,260 |
Source: Public Records
Map
Nearby Homes
- 539 29 3/8 Rd Unit A
- 539 29 3/8 Rd
- 2942 Sandra Ave Unit B
- 2942 Sandra Ave Unit A
- 537 29 3/8 Rd Unit B
- 537 29 3/8 Rd Unit A
- 537 29 3 8 Rd Unit A
- 2944 Sandra Ave Unit A
- 535 29 3/8 Rd Unit B
- 535 29 3/8 Rd Unit A
- 2943 Sandra Ave Unit B
- 2943 Sandra Ave Unit A
- 0 Sandra Avenue A
- 2942 N Palace Cir Unit B
- 2942 N Palace Cir Unit A
- 533 29 3/8 Rd Unit B
- 533 29 3/8 Rd Unit A
- 541 29 1/2 Rd
- 2945 Sandra Ave Unit A
- 2944 N Palace Cir Unit B