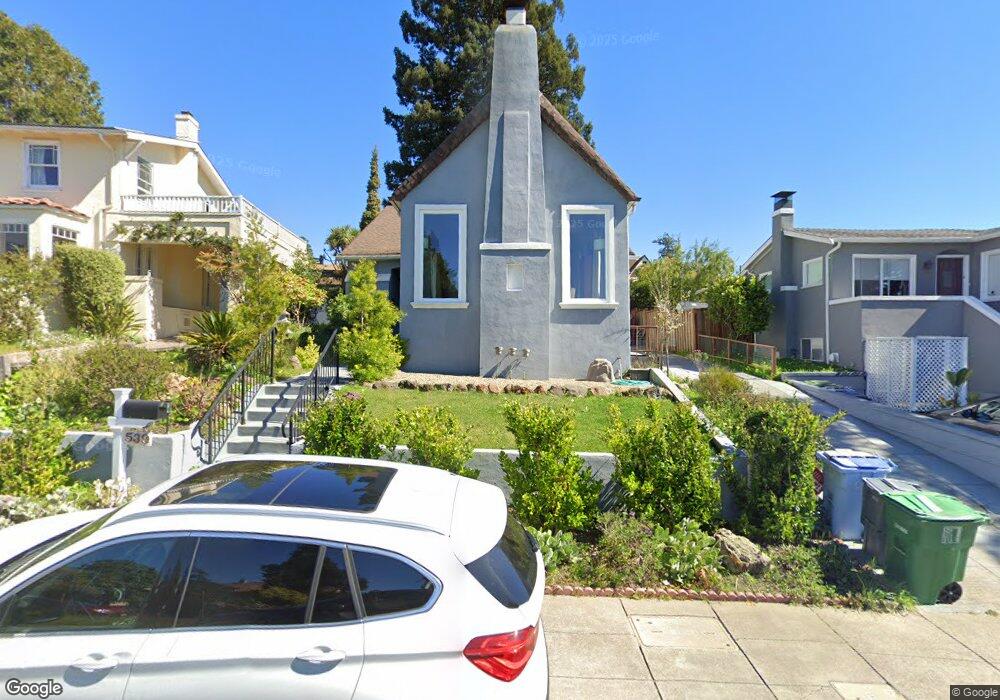
539 Arlington Ave Berkeley, CA 94707
Estimated Value: $1,578,000 - $1,774,822
4
Beds
2
Baths
1,998
Sq Ft
$845/Sq Ft
Est. Value
About This Home
This home is located at 539 Arlington Ave, Berkeley, CA 94707 and is currently estimated at $1,687,456, approximately $844 per square foot. 539 Arlington Ave is a home located in Alameda County with nearby schools including Thousand Oaks Elementary School, Berkeley Arts Magnet at Whittier School, and Ruth Acty Elementary.
Ownership History
Date
Name
Owned For
Owner Type
Purchase Details
Closed on
Feb 20, 2018
Sold by
Singha Inderpreet K
Bought by
Samareen Zaidi Syed Salman and Samareen Shami
Current Estimated Value
Home Financials for this Owner
Home Financials are based on the most recent Mortgage that was taken out on this home.
Original Mortgage
$975,000
Outstanding Balance
$813,346
Interest Rate
3.5%
Mortgage Type
Adjustable Rate Mortgage/ARM
Estimated Equity
$874,110
Purchase Details
Closed on
Apr 19, 2017
Sold by
Singh Gurvinder
Bought by
Singh Inderpreet K
Purchase Details
Closed on
Apr 13, 2017
Sold by
Transamerica Premier Life Insurance Comp
Bought by
Ksingh Inderpreet
Purchase Details
Closed on
Oct 26, 2016
Sold by
Mack Carl C and Mack Valerie D
Bought by
Transamerica Premier Life Insurance Comp and Monumental Life Insurance Company
Purchase Details
Closed on
Aug 14, 1995
Sold by
Mack Carl C and Mack Valerie D
Bought by
Mack Carl C and Mack Valerie Delores
Create a Home Valuation Report for This Property
The Home Valuation Report is an in-depth analysis detailing your home's value as well as a comparison with similar homes in the area
Home Values in the Area
Average Home Value in this Area
Purchase History
| Date | Buyer | Sale Price | Title Company |
|---|---|---|---|
| Samareen Zaidi Syed Salman | $1,300,000 | Chicago Title Company | |
| Singh Inderpreet K | -- | Chicago Title Company | |
| Ksingh Inderpreet | $970,000 | Chicago Title Company | |
| Transamerica Premier Life Insurance Comp | $1,103,677 | None Available | |
| Mack Carl C | -- | -- |
Source: Public Records
Mortgage History
| Date | Status | Borrower | Loan Amount |
|---|---|---|---|
| Open | Samareen Zaidi Syed Salman | $975,000 |
Source: Public Records
Tax History
| Year | Tax Paid | Tax Assessment Tax Assessment Total Assessment is a certain percentage of the fair market value that is determined by local assessors to be the total taxable value of land and additions on the property. | Land | Improvement |
|---|---|---|---|---|
| 2025 | $21,964 | $1,479,153 | $568,905 | $910,248 |
| 2024 | $21,964 | $1,450,150 | $557,750 | $892,400 |
| 2023 | $21,469 | $1,421,719 | $546,815 | $874,904 |
| 2022 | $21,059 | $1,393,847 | $536,095 | $857,752 |
| 2021 | $21,134 | $1,366,521 | $525,585 | $840,936 |
| 2020 | $20,097 | $1,352,520 | $520,200 | $832,320 |
| 2019 | $19,408 | $1,326,000 | $510,000 | $816,000 |
| 2018 | $15,287 | $989,400 | $408,000 | $581,400 |
| 2017 | $16,609 | $1,000,000 | $400,000 | $600,000 |
| 2016 | $5,179 | $91,130 | $54,678 | $36,452 |
| 2015 | $5,057 | $89,761 | $53,857 | $35,904 |
| 2014 | $4,922 | $88,003 | $52,802 | $35,201 |
Source: Public Records
Map
Nearby Homes
- 589 San Luis Rd
- 483 Boynton Ave
- 450 Vermont Ave
- 380 Vermont Ave
- 1983 Yosemite Rd
- 491 Vincente Ave
- 765 San Diego Rd
- 1858 San Lorenzo Ave
- 470 Spruce St
- 614 Cragmont Ave
- 255 Stanford Ave
- 758 Spruce St
- 813 San Diego Rd
- 410 Grizzly Peak Blvd
- 201 Amherst Ave
- 290 Colgate Ave
- 415 Berkeley Park Blvd
- 777 Cragmont Ave
- 249 Trinity Ave
- 606 Grizzly Peak Blvd
- 545 Arlington Ave
- 535 Arlington Ave
- 551 Arlington Ave
- 47 Avis Rd
- 522 San Luis Rd
- 37 Avis Rd
- 557 Arlington Ave
- 501 San Luis Rd
- 27 Avis Rd
- 540 Arlington Ave
- 0 San Luis Rd
- 534 Arlington Ave
- 546 Arlington Ave
- 530 Arlington Ave
- 565 Arlington Ave
- 21 Avis Rd
- 68 Avis Rd
- 515 Arlington Ave
- 0 Arlington Ave
- 527 San Luis Rd
Your Personal Tour Guide
Ask me questions while you tour the home.