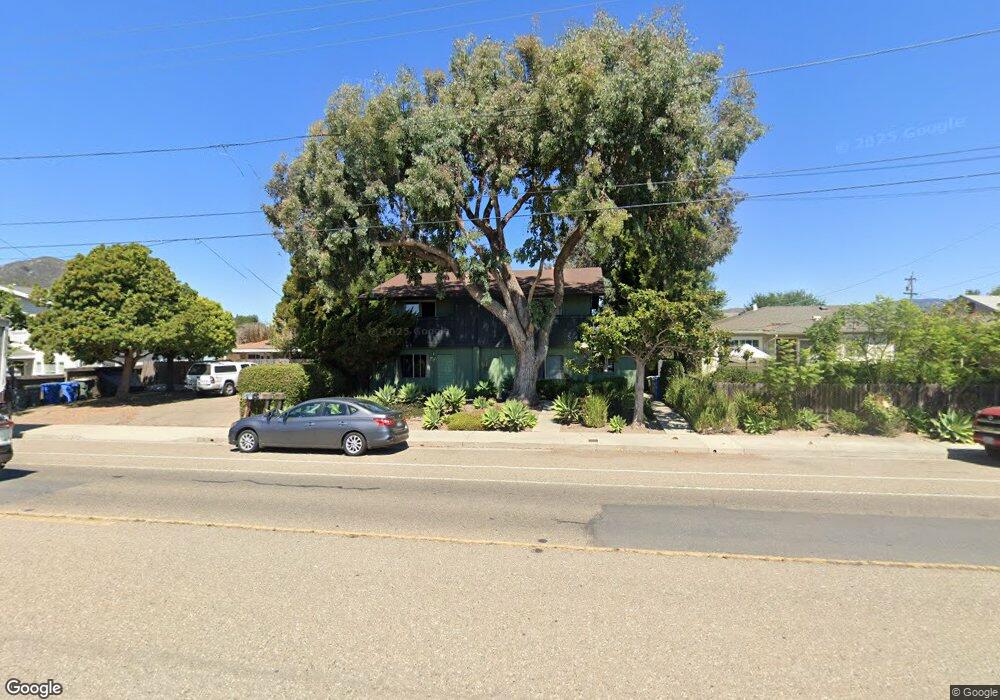
539 Branch St San Luis Obispo, CA 93401
Higuera NeighborhoodEstimated Value: $1,461,000 - $1,980,000
8
Beds
4
Baths
4,024
Sq Ft
$451/Sq Ft
Est. Value
About This Home
This home is located at 539 Branch St, San Luis Obispo, CA 93401 and is currently estimated at $1,816,130, approximately $451 per square foot. 539 Branch St is a home located in San Luis Obispo County with nearby schools including Laguna Middle School, San Luis Obispo High School, and San Luis Obispo Classical Academy.
Ownership History
Date
Name
Owned For
Owner Type
Purchase Details
Closed on
Apr 24, 2006
Sold by
Lysek Trevor and Wittmer Lysek Mary
Bought by
Lysek Trevor Cordell and Wittmer Lysek Mary Verne
Current Estimated Value
Purchase Details
Closed on
Jul 13, 1998
Sold by
Speck Glen W and Speck Ruth C
Bought by
Lysek Trevor and Wittmer Lysek Mary
Home Financials for this Owner
Home Financials are based on the most recent Mortgage that was taken out on this home.
Original Mortgage
$304,000
Outstanding Balance
$62,266
Interest Rate
7.01%
Estimated Equity
$1,753,864
Create a Home Valuation Report for This Property
The Home Valuation Report is an in-depth analysis detailing your home's value as well as a comparison with similar homes in the area
Home Values in the Area
Average Home Value in this Area
Purchase History
| Date | Buyer | Sale Price | Title Company |
|---|---|---|---|
| Lysek Trevor Cordell | -- | None Available | |
| Lysek Trevor | $380,000 | Cuesta Title |
Source: Public Records
Mortgage History
| Date | Status | Borrower | Loan Amount |
|---|---|---|---|
| Open | Lysek Trevor | $304,000 |
Source: Public Records
Tax History Compared to Growth
Tax History
| Year | Tax Paid | Tax Assessment Tax Assessment Total Assessment is a certain percentage of the fair market value that is determined by local assessors to be the total taxable value of land and additions on the property. | Land | Improvement |
|---|---|---|---|---|
| 2025 | $6,437 | $594,144 | $235,144 | $359,000 |
| 2024 | $6,321 | $582,495 | $230,534 | $351,961 |
| 2023 | $6,321 | $571,074 | $226,014 | $345,060 |
| 2022 | $5,925 | $559,878 | $221,583 | $338,295 |
| 2021 | $5,831 | $548,901 | $217,239 | $331,662 |
| 2020 | $5,771 | $543,274 | $215,012 | $328,262 |
| 2019 | $5,711 | $532,623 | $210,797 | $321,826 |
| 2018 | $5,599 | $522,180 | $206,664 | $315,516 |
| 2017 | $5,489 | $511,942 | $202,612 | $309,330 |
| 2016 | $5,382 | $501,905 | $198,640 | $303,265 |
| 2015 | $5,300 | $494,367 | $195,657 | $298,710 |
| 2014 | $4,866 | $484,684 | $191,825 | $292,859 |
Source: Public Records
Map
Nearby Homes
- 2250 King Ct Unit 89
- 2082 Harris St
- 2220 Exposition Dr Unit 94
- 2418 Cumbre Ct
- 717 Islay St
- 2475 Victoria Ave Unit 406
- 1536 Garden St
- 1407 Beach St
- 1010 Church St
- 1043 Ella St Unit 9
- 1079 Pauline Way
- 1700 Osos St
- 1075 Ella St Unit 3
- 145 South St Unit A21
- 145 South St Unit A-27
- 145 South St Unit A41
- 145 South St Unit A28
- 145 South St Unit B08
- 880 Buchon St
- 489 Bluerock Dr