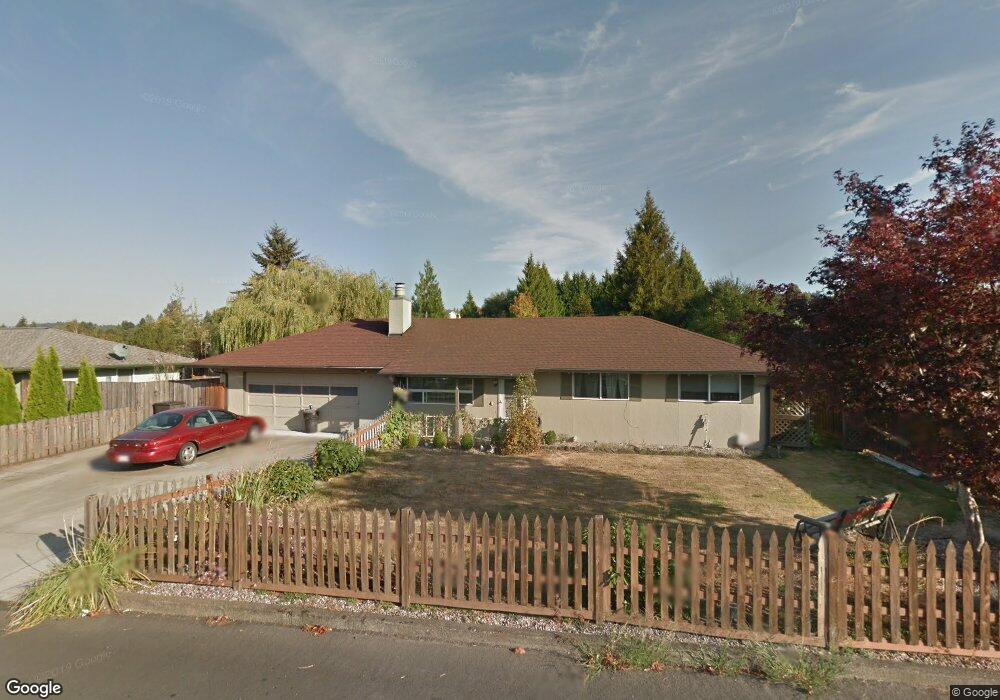
539 E 6th St La Center, WA 98629
Estimated Value: $384,995 - $438,000
3
Beds
1
Bath
1,008
Sq Ft
$405/Sq Ft
Est. Value
About This Home
This home is located at 539 E 6th St, La Center, WA 98629 and is currently estimated at $407,749, approximately $404 per square foot. 539 E 6th St is a home located in Clark County with nearby schools including La Center Elementary School, La Center Middle School, and La Center High School.
Ownership History
Date
Name
Owned For
Owner Type
Purchase Details
Closed on
Nov 7, 2014
Sold by
Manning Melissa P
Bought by
Hall Lloyd and Hall Susan M
Current Estimated Value
Home Financials for this Owner
Home Financials are based on the most recent Mortgage that was taken out on this home.
Original Mortgage
$175,750
Outstanding Balance
$135,421
Interest Rate
4.16%
Mortgage Type
New Conventional
Estimated Equity
$272,328
Purchase Details
Closed on
May 24, 2002
Sold by
Cook Eugene I
Bought by
Manning Melissa P
Home Financials for this Owner
Home Financials are based on the most recent Mortgage that was taken out on this home.
Original Mortgage
$116,078
Interest Rate
6.89%
Mortgage Type
FHA
Purchase Details
Closed on
Sep 11, 1997
Sold by
Jackson Raylene M
Bought by
Robinson Roxann and Hansen Donna
Purchase Details
Closed on
Sep 8, 1997
Sold by
Robinson Roxann and Hansen Donna
Bought by
Cook Eugene I
Create a Home Valuation Report for This Property
The Home Valuation Report is an in-depth analysis detailing your home's value as well as a comparison with similar homes in the area
Home Values in the Area
Average Home Value in this Area
Purchase History
| Date | Buyer | Sale Price | Title Company |
|---|---|---|---|
| Hall Lloyd | $184,719 | Clark County Title | |
| Manning Melissa P | $117,900 | Cascade Title | |
| Robinson Roxann | -- | Charter Title Corp | |
| Cook Eugene I | -- | Charter Title Corp |
Source: Public Records
Mortgage History
| Date | Status | Borrower | Loan Amount |
|---|---|---|---|
| Open | Hall Lloyd | $175,750 | |
| Previous Owner | Manning Melissa P | $116,078 |
Source: Public Records
Tax History
| Year | Tax Paid | Tax Assessment Tax Assessment Total Assessment is a certain percentage of the fair market value that is determined by local assessors to be the total taxable value of land and additions on the property. | Land | Improvement |
|---|---|---|---|---|
| 2025 | $2,965 | $329,931 | $154,500 | $175,431 |
| 2024 | $2,846 | $320,974 | $154,500 | $166,474 |
| 2023 | $2,666 | $320,781 | $150,000 | $170,781 |
| 2022 | $2,530 | $290,302 | $122,500 | $167,802 |
| 2021 | $2,449 | $244,580 | $98,000 | $146,580 |
| 2020 | $2,347 | $223,002 | $91,000 | $132,002 |
| 2019 | $2,228 | $208,992 | $81,900 | $127,092 |
| 2018 | $2,007 | $201,999 | $0 | $0 |
| 2017 | $1,783 | $179,946 | $0 | $0 |
| 2016 | $1,739 | $169,617 | $0 | $0 |
Source: Public Records
Map
Nearby Homes
- 135 E Airedale Ave
- 1241 E Southview Heights Dr
- 1189 E Ennis Ct
- 1035 E Pioneer Loop
- 725 Aspen Ave
- 1319 Aspen Ave
- 734 E 15th Cir
- 1202 W Avocet Place
- 134 E Joyce Ct
- 108 W 16th St
- 525 E 17th Cir
- 1292 E Lucas St
- 306 E 16th Place
- 142 W 20th Way
- 310 W 20th Way
- 403 W 19th St
- 404 W 20th Way
- 410 W 20th Way
- 516 W 20th Way
- 2027 E Otter Loop Unit 68
Your Personal Tour Guide
Ask me questions while you tour the home.