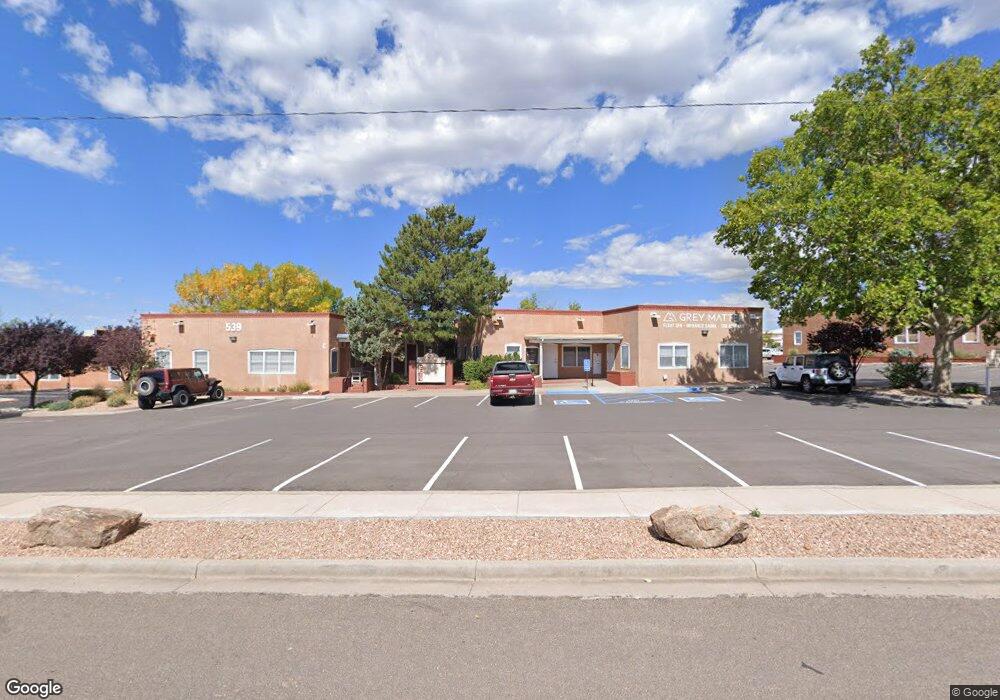
539 Harkle Rd Unit Suite A Santa Fe, NM 87505
San Mateo NeighborhoodEstimated Value: $515,490
--
Bed
--
Bath
1,417
Sq Ft
$364/Sq Ft
Est. Value
About This Home
This home is located at 539 Harkle Rd Unit Suite A, Santa Fe, NM 87505 and is currently estimated at $515,490, approximately $363 per square foot. 539 Harkle Rd Unit Suite A is a home located in Santa Fe County with nearby schools including E.J. Martinez Elementary School, Santa Fe High School, and The Tutorial School.
Create a Home Valuation Report for This Property
The Home Valuation Report is an in-depth analysis detailing your home's value as well as a comparison with similar homes in the area
Home Values in the Area
Average Home Value in this Area
Tax History Compared to Growth
Tax History
| Year | Tax Paid | Tax Assessment Tax Assessment Total Assessment is a certain percentage of the fair market value that is determined by local assessors to be the total taxable value of land and additions on the property. | Land | Improvement |
|---|---|---|---|---|
| 2024 | $2,303 | $214,486 | -- | $214,486 |
| 2023 | $3,034 | $283,015 | $0 | $283,015 |
| 2022 | $2,404 | $220,783 | $0 | $220,783 |
| 2021 | $2,476 | $75,320 | $0 | $75,320 |
| 2020 | $3,071 | $94,016 | $0 | $94,016 |
| 2019 | $3,083 | $94,016 | $0 | $94,016 |
| 2018 | $3,093 | $94,016 | $0 | $94,016 |
| 2017 | $3,114 | $94,016 | $0 | $94,016 |
| 2016 | $3,028 | $94,017 | $0 | $94,017 |
| 2015 | $2,118 | $66,727 | $0 | $66,727 |
| 2014 | $2,576 | $81,818 | $0 | $81,818 |
Source: Public Records
Map
Nearby Homes
- 439 Calle Bonita
- 1566 Camino Amado
- 151 Calle Ojo Feliz Unit T
- 147 Calle Ojo Feliz Unit U
- 157 Calle Ojo Feliz Unit D
- 149 Calle Ojo Feliz Unit B
- 150 Calle Ojo Feliz
- 601 W San Mateo Rd Unit 188
- 601 W San Mateo Rd Unit 10
- 123 E Lupita Rd
- 166 Galisteo Ln
- 814 Camino de Monte Rey Unit 221
- 814 Camino de Monte Rey Unit 325
- 814 Camino de Monte Rey Unit 301
- 730 Columbia St Unit D
- 125 Chamiso Ln
- 2210 Miguel Chavez Rd Unit 1616
- 2210 Miguel Chavez Rd Unit 812
- 2210 Miguel Chavez Rd Unit 723
- 2210 Miguel Chavez Rd Unit 1814
- 539 Harkle Rd Unit C
- 531 Harkle Rd
- 531 Harkle Rd Unit A
- 531 Harkle Rd Unit Suite A
- 531 Harkle Rd Unit Suite B
- 531 Harkle Rd Unit D and E
- 534 Harkle Rd
- 1651 Galisteo St Unit 1
- 1651 Galisteo St Unit 3
- 1651 Galisteo St Unit 4
- 1651 Galisteo St Unit 5
- 1651 Galisteo St Unit 7
- 1651 Galisteo St Unit 11-A2
- 1651 Galisteo St Unit 1-2
- 1651 Galisteo St Unit 11
- 1651 Galisteo St Unit Suite 1A
- 1651 Galisteo St
- 1691 Galisteo St
- 1691 Galisteo St Unit A
- 1691 Galisteo St Unit B