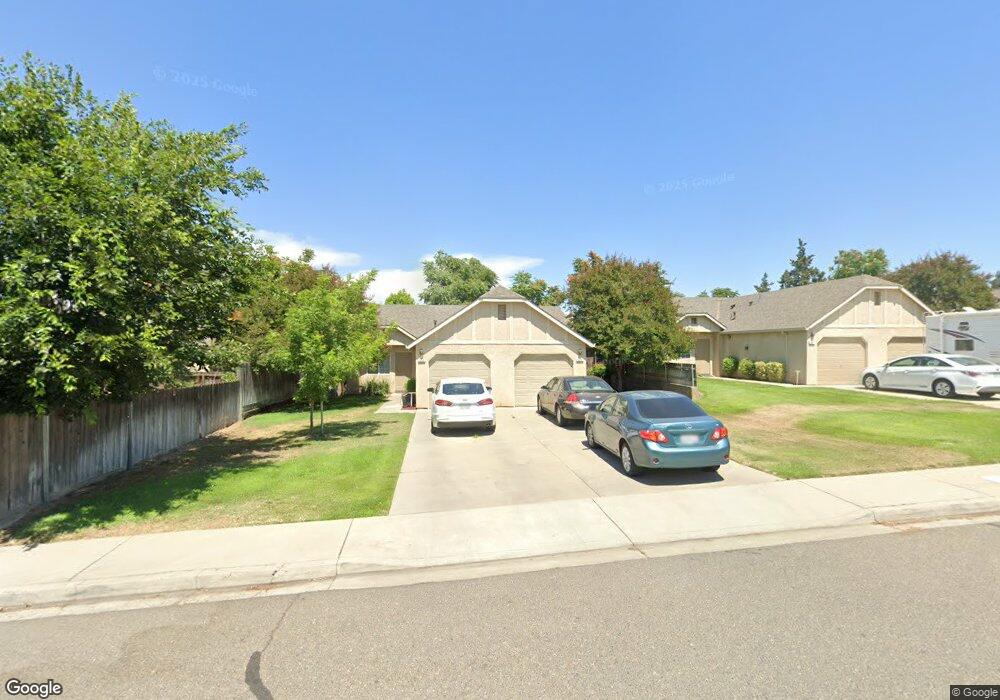
539 Mann Ct Oakdale, CA 95361
Estimated Value: $424,192 - $528,000
2
Beds
2
Baths
1,760
Sq Ft
$271/Sq Ft
Est. Value
About This Home
This home is located at 539 Mann Ct, Oakdale, CA 95361 and is currently estimated at $476,096, approximately $270 per square foot. 539 Mann Ct is a home located in Stanislaus County with nearby schools including Fair Oaks Elementary School, Oakdale Junior High School, and Oakdale High School.
Ownership History
Date
Name
Owned For
Owner Type
Purchase Details
Closed on
Oct 11, 2018
Sold by
Boese Bruce 1A
Bought by
Return 1031 Llc
Current Estimated Value
Purchase Details
Closed on
Dec 30, 2009
Sold by
Boese Inc
Bought by
Boese Bruce A and Boese Rhonda L
Purchase Details
Closed on
Feb 24, 2009
Sold by
Boese Investments Lp
Bought by
Boese Inc
Purchase Details
Closed on
Jun 6, 2005
Sold by
Boese Bruce A
Bought by
Boese Inc
Purchase Details
Closed on
Oct 20, 2004
Sold by
Boese Bruce
Bought by
Boese Bruce A and Boese Rhonda L
Home Financials for this Owner
Home Financials are based on the most recent Mortgage that was taken out on this home.
Original Mortgage
$57,353
Interest Rate
6.06%
Mortgage Type
Commercial
Purchase Details
Closed on
Sep 1, 2004
Sold by
Kruetzfeldt Dan
Bought by
Boese Bruce and Boese Rhonda
Home Financials for this Owner
Home Financials are based on the most recent Mortgage that was taken out on this home.
Original Mortgage
$57,353
Interest Rate
6.06%
Mortgage Type
Commercial
Create a Home Valuation Report for This Property
The Home Valuation Report is an in-depth analysis detailing your home's value as well as a comparison with similar homes in the area
Home Values in the Area
Average Home Value in this Area
Purchase History
We collect this data history from publicly available records. To have your information removed, we recommend requesting removal directly through your county’s website.
| Date | Buyer | Sale Price | Title Company |
|---|---|---|---|
| Return 1031 Llc | $300,000 | Chicago Title Co | |
| Boese Bruce A | -- | None Available | |
| Boese Inc | -- | None Available | |
| Boese Inc | -- | -- | |
| Boese Investments Lp | -- | -- | |
| Boese Bruce A | -- | -- | |
| Boese Bruce | $739,500 | Fidelity National Title |
Source: Public Records
Mortgage History
We collect this data history from publicly available records. To have your information removed, we recommend requesting removal directly through your county’s website.
| Date | Status | Borrower | Loan Amount |
|---|---|---|---|
| Previous Owner | Boese Bruce | $57,353 |
Source: Public Records
Tax History
| Year | Tax Paid | Tax Assessment Tax Assessment Total Assessment is a certain percentage of the fair market value that is determined by local assessors to be the total taxable value of land and additions on the property. | Land | Improvement |
|---|---|---|---|---|
| 2025 | $3,984 | $356,959 | $72,505 | $284,454 |
| 2024 | $3,778 | $349,961 | $71,084 | $278,877 |
| 2023 | $3,698 | $343,100 | $69,691 | $273,409 |
| 2022 | $3,636 | $336,374 | $68,325 | $268,049 |
| 2021 | $3,576 | $329,780 | $66,986 | $262,794 |
| 2020 | $3,536 | $326,400 | $66,300 | $260,100 |
| 2019 | $3,722 | $342,000 | $71,500 | $270,500 |
| 2018 | $3,564 | $325,500 | $68,000 | $257,500 |
| 2017 | $3,248 | $296,000 | $62,000 | $234,000 |
| 2016 | $2,958 | $269,000 | $56,500 | $212,500 |
| 2015 | $2,470 | $224,000 | $56,500 | $167,500 |
| 2014 | $2,229 | $200,000 | $56,500 | $143,500 |
Source: Public Records
Map
Nearby Homes
- 788 Mann Ct
- 863 Meadowlands Dr
- 871 Meadowlands Dr
- 909 Meadowlands Dr
- 1001 Meadowlands Dr
- 1005 Meadowlands Dr
- 1012 Longview Dr
- 1010 Meadowlands Dr
- 1009 Meadowlands Dr
- 245 Bardo Ave
- 1014 Meadowlands Dr
- 1013 Meadowlands Dr
- 561 Wild Stallion Dr Unit 151
- 1018 Meadowlands Dr
- 1017 Meadowlands Dr
- 332 Hinkley Ave
- 1021 Meadowlands Dr
- 575 Wild Stallion Dr Unit 15
- 1025 Meadowlands Dr
- 324 Church Ave
Your Personal Tour Guide
Ask me questions while you tour the home.