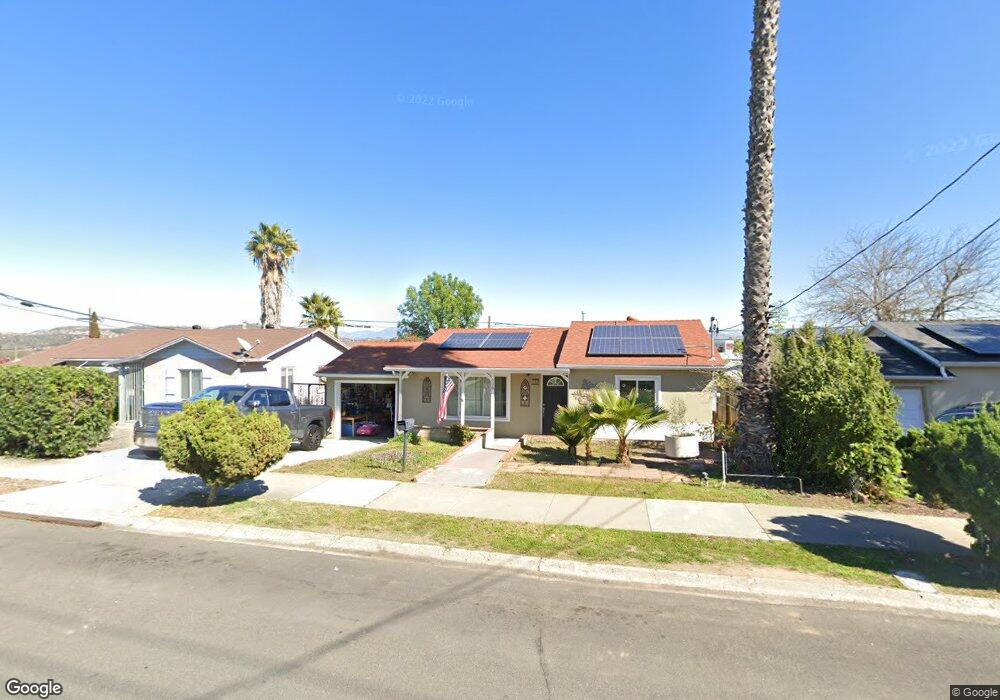
539 N Cuyamaca St El Cajon, CA 92020
Estimated Value: $762,000 - $921,059
4
Beds
2
Baths
1,840
Sq Ft
$468/Sq Ft
Est. Value
About This Home
This home is located at 539 N Cuyamaca St, El Cajon, CA 92020 and is currently estimated at $860,515, approximately $467 per square foot. 539 N Cuyamaca St is a home located in San Diego County with nearby schools including Flying Hills Elementary School, Grossmont High School, and Grossmont Secondary School.
Ownership History
Date
Name
Owned For
Owner Type
Purchase Details
Closed on
Jun 2, 2015
Sold by
Lewis Matthew J and Garcia Lewis Dolores E
Bought by
Lewis Matthew J and Garcia Lewis Dolores E
Current Estimated Value
Home Financials for this Owner
Home Financials are based on the most recent Mortgage that was taken out on this home.
Original Mortgage
$428,553
Outstanding Balance
$330,617
Interest Rate
3.64%
Mortgage Type
VA
Estimated Equity
$529,898
Purchase Details
Closed on
Nov 24, 2014
Sold by
Ct Dream Realty Llc
Bought by
Lewis Matthew J and Garcia Lewis Dolores E
Home Financials for this Owner
Home Financials are based on the most recent Mortgage that was taken out on this home.
Original Mortgage
$429,030
Interest Rate
3.95%
Mortgage Type
VA
Purchase Details
Closed on
Apr 8, 2014
Sold by
Yusufoff Ismail and Yusufoff Iman Embieva
Bought by
Ct Dream Realty Llc
Home Financials for this Owner
Home Financials are based on the most recent Mortgage that was taken out on this home.
Original Mortgage
$217,100
Interest Rate
4.23%
Mortgage Type
Purchase Money Mortgage
Purchase Details
Closed on
Jan 29, 1992
Create a Home Valuation Report for This Property
The Home Valuation Report is an in-depth analysis detailing your home's value as well as a comparison with similar homes in the area
Home Values in the Area
Average Home Value in this Area
Purchase History
| Date | Buyer | Sale Price | Title Company |
|---|---|---|---|
| Lewis Matthew J | -- | Title 365 | |
| Lewis Matthew J | $420,000 | Ticor Title | |
| Ct Dream Realty Llc | $334,000 | Ticor Title | |
| -- | $119,500 | -- |
Source: Public Records
Mortgage History
| Date | Status | Borrower | Loan Amount |
|---|---|---|---|
| Open | Lewis Matthew J | $428,553 | |
| Closed | Lewis Matthew J | $429,030 | |
| Previous Owner | Ct Dream Realty Llc | $217,100 |
Source: Public Records
Tax History Compared to Growth
Tax History
| Year | Tax Paid | Tax Assessment Tax Assessment Total Assessment is a certain percentage of the fair market value that is determined by local assessors to be the total taxable value of land and additions on the property. | Land | Improvement |
|---|---|---|---|---|
| 2025 | $4,764 | $515,922 | $187,685 | $328,237 |
| 2024 | $4,764 | $505,806 | $184,005 | $321,801 |
| 2023 | $4,579 | $495,890 | $180,398 | $315,492 |
| 2022 | $4,619 | $486,167 | $176,861 | $309,306 |
| 2021 | $4,535 | $476,636 | $173,394 | $303,242 |
| 2020 | $4,586 | $471,750 | $171,617 | $300,133 |
| 2019 | $3,893 | $456,501 | $168,252 | $288,249 |
| 2018 | $8,676 | $443,629 | $164,953 | $278,676 |
| 2017 | $10,143 | $434,931 | $161,719 | $273,212 |
| 2016 | $9,930 | $426,404 | $158,549 | $267,855 |
| 2015 | $5,054 | $420,000 | $156,168 | $263,832 |
| 2014 | -- | $287,075 | $113,134 | $173,941 |
Source: Public Records
Map
Nearby Homes
- 701 El Monte Rd
- 1387 Weers St
- 370 N Cuyamaca St
- 741 N Pierce St
- 731 Dewane Dr
- 346 El Monte Rd
- 1673 Hillsmont Dr
- 1681 Hillsmont Dr
- 1280 W Main St Unit 24
- 1280 W Main St Unit 6
- 168 S Pierce St
- 927 W Main St
- 589 N Johnson Ave Unit 247
- 589 N Johnson Ave Unit 130
- 1340 Heron Ave
- 1958 Milford Place
- 484 Gardner St
- 302 Travelodge Dr
- 275 Hihill Way
- 436 Gardner St
- 547 N Cuyamaca St
- 531 N Cuyamaca St
- 525 N Cuyamaca St
- 540 El Monte Rd
- 548 El Monte Rd
- 532 El Monte Rd
- 519 N Cuyamaca St
- 601 N Cuyamaca St
- 528 El Monte Rd
- 540 N Cuyamaca St
- 548 N Cuyamaca St
- 532 N Cuyamaca St
- 604 El Monte Rd
- 528 N Cuyamaca St
- 511 N Cuyamaca St
- 520 El Monte Rd
- 609 N Cuyamaca St
- 520 N Cuyamaca St
- 604 N Cuyamaca St
- 612 El Monte Rd