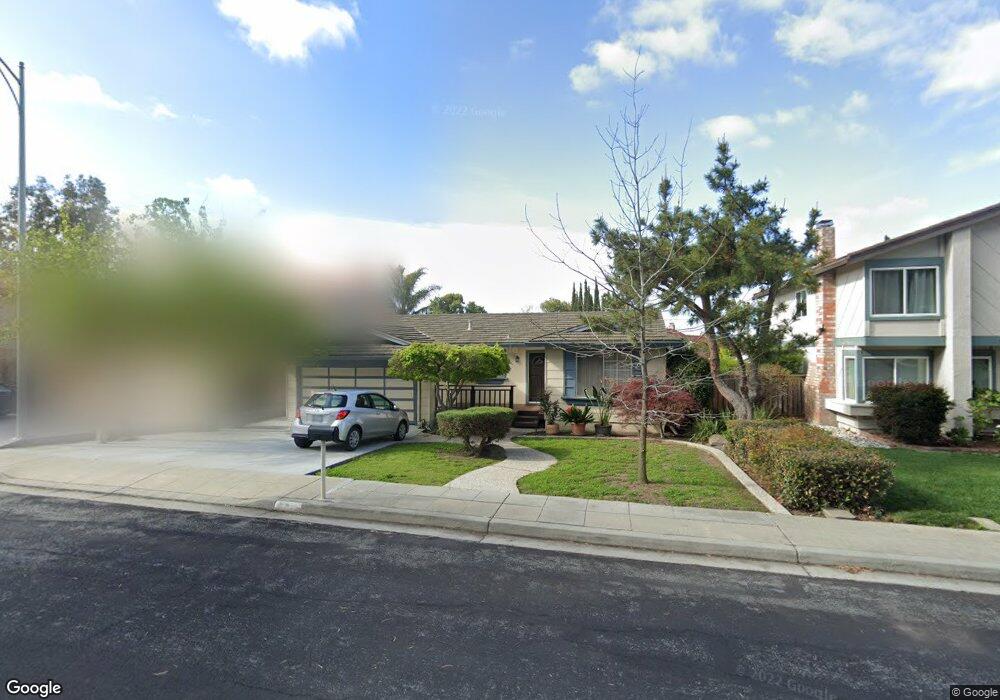
539 Old Evans Rd Milpitas, CA 95035
Estimated Value: $1,667,183 - $1,884,000
4
Beds
2
Baths
1,463
Sq Ft
$1,218/Sq Ft
Est. Value
About This Home
This home is located at 539 Old Evans Rd, Milpitas, CA 95035 and is currently estimated at $1,781,296, approximately $1,217 per square foot. 539 Old Evans Rd is a home located in Santa Clara County with nearby schools including William Burnett Elementary School, Thomas Russell Middle School, and Milpitas High School.
Ownership History
Date
Name
Owned For
Owner Type
Purchase Details
Closed on
Jan 27, 2025
Sold by
Le Quang Minh and Hoang Bach Tuyet
Bought by
Le And Hoang Family Trust and Le
Current Estimated Value
Purchase Details
Closed on
Mar 21, 2001
Sold by
Le Quang Minh and Hoang Tuyet Bach
Bought by
Le Quang Minh and Hoang Tuyet Bach
Home Financials for this Owner
Home Financials are based on the most recent Mortgage that was taken out on this home.
Original Mortgage
$120,000
Interest Rate
7.19%
Purchase Details
Closed on
Jul 27, 2000
Sold by
Vo Trung Ta
Bought by
Le Quang Minh and Hoang Tuyet Bach
Purchase Details
Closed on
Jul 9, 1999
Sold by
Pham Mai Phuong
Bought by
Vo Trung
Home Financials for this Owner
Home Financials are based on the most recent Mortgage that was taken out on this home.
Original Mortgage
$130,000
Interest Rate
7.4%
Create a Home Valuation Report for This Property
The Home Valuation Report is an in-depth analysis detailing your home's value as well as a comparison with similar homes in the area
Home Values in the Area
Average Home Value in this Area
Purchase History
| Date | Buyer | Sale Price | Title Company |
|---|---|---|---|
| Le And Hoang Family Trust | -- | None Listed On Document | |
| Le Quang Minh | -- | Alliance Title Company | |
| Le Quang Minh | -- | -- | |
| Vo Trung | -- | Alliance Title Company | |
| Le Quang | $345,000 | Alliance Title Company |
Source: Public Records
Mortgage History
| Date | Status | Borrower | Loan Amount |
|---|---|---|---|
| Previous Owner | Le Quang Minh | $120,000 | |
| Previous Owner | Le Quang | $130,000 |
Source: Public Records
Tax History
| Year | Tax Paid | Tax Assessment Tax Assessment Total Assessment is a certain percentage of the fair market value that is determined by local assessors to be the total taxable value of land and additions on the property. | Land | Improvement |
|---|---|---|---|---|
| 2025 | $6,470 | $554,387 | $229,285 | $325,102 |
| 2024 | $6,470 | $543,518 | $224,790 | $318,728 |
| 2023 | $6,470 | $532,862 | $220,383 | $312,479 |
| 2022 | $6,425 | $522,414 | $216,062 | $306,352 |
| 2021 | $6,332 | $512,172 | $211,826 | $300,346 |
| 2020 | $6,222 | $506,921 | $209,654 | $297,267 |
| 2019 | $6,153 | $496,983 | $205,544 | $291,439 |
| 2018 | $5,847 | $487,239 | $201,514 | $285,725 |
| 2017 | $5,772 | $477,686 | $197,563 | $280,123 |
| 2016 | $5,538 | $468,321 | $193,690 | $274,631 |
| 2015 | $5,482 | $461,287 | $190,781 | $270,506 |
| 2014 | $5,330 | $452,252 | $187,044 | $265,208 |
Source: Public Records
Map
Nearby Homes
- 1995 Old Calaveras Rd
- 533 Ramos Ct
- 258 Lynn Ave
- 122 Poppy Ct
- 25 Terfidia Ln
- 70 Fanyon St
- 1103 Creed St
- 685 Parvin Dr
- 1000 Jacklin Rd
- 1308 N Hillview Dr
- 496 Dempsey Rd Unit 199
- 484 Dempsey Rd Unit 186
- 979 Sandalridge Ct
- 650 Folsom Cir
- 931 Galindo Ct
- 1490 Mount Diablo Ave
- 2000 Wellington Dr
- 853 Erie Cir
- 997 Courtland Ct
- 1759 Tahoe Dr
- 527 Old Evans Rd
- 551 Old Evans Rd
- 1673 Quail Dr
- 515 Old Evans Rd
- 1661 Quail Dr
- 571 Bayview Park Dr
- 1676 Serpa Dr
- 548 Alexander Way
- 1666 Serpa Dr
- 1676 Quail Dr
- 1656 Serpa Dr
- 503 Old Evans Rd
- 565 Bayview Park Dr
- 580 Bayview Park Dr
- 1649 Quail Dr
- 542 Alexander Way
- 1646 Serpa Dr
- 574 Bayview Park Dr
- 519 Alexander Way
- 1670 Quail Dr