Estimated Value: $348,433 - $465,000
2
Beds
1
Bath
852
Sq Ft
$483/Sq Ft
Est. Value
About This Home
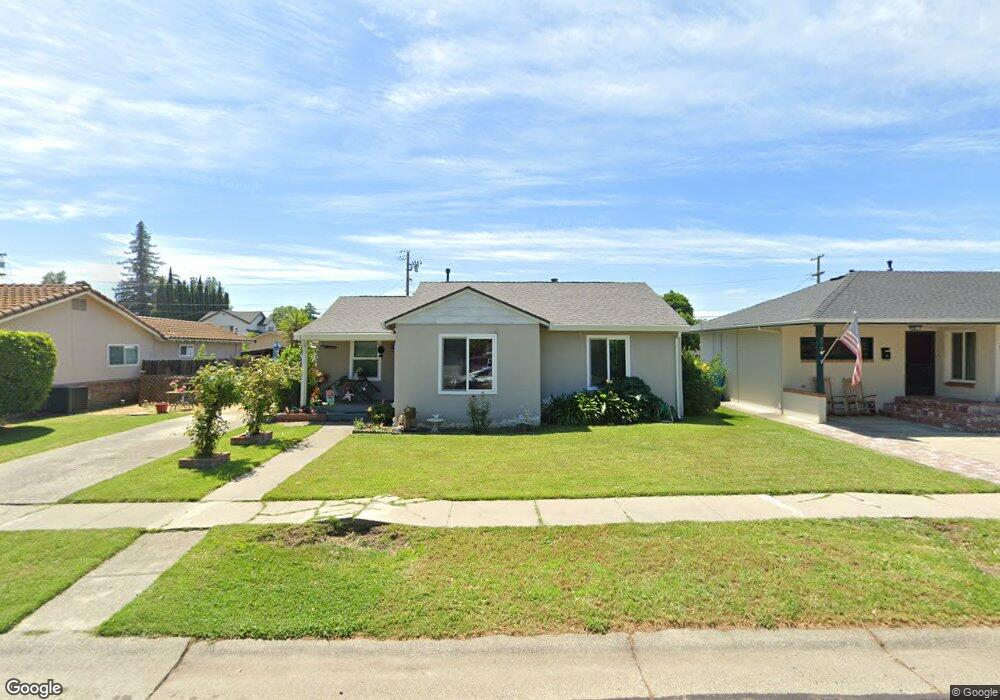
This home is located at 539 W C St, Dixon, CA 95620 and is currently estimated at $411,608, approximately $483 per square foot. 539 W C St is a home located in Solano County with nearby schools including Anderson (Linford L.) Elementary School, Dixon High School, and Dixon Montessori Charter.
Ownership History
Date
Name
Owned For
Owner Type
Purchase Details
Closed on
Sep 20, 2018
Sold by
Ash Rosemarie
Bought by
Ash Rosemarie and Rosemarie Ash Living Trust
Current Estimated Value
Purchase Details
Closed on
Sep 9, 1999
Sold by
Rosemarie Ash
Bought by
Ash Rosemarie
Home Financials for this Owner
Home Financials are based on the most recent Mortgage that was taken out on this home.
Original Mortgage
$36,500
Interest Rate
7.43%
Purchase Details
Closed on
May 15, 1996
Sold by
Ash Lloyd Wayne
Bought by
Ash Rosemarie
Create a Home Valuation Report for This Property
The Home Valuation Report is an in-depth analysis detailing your home's value as well as a comparison with similar homes in the area
Home Values in the Area
Average Home Value in this Area
Purchase History
| Date | Buyer | Sale Price | Title Company |
|---|---|---|---|
| Ash Rosemarie | -- | None Available | |
| Ash Rosemarie | -- | Financial Title Company | |
| Ash Rosemarie | -- | -- |
Source: Public Records
Mortgage History
| Date | Status | Borrower | Loan Amount |
|---|---|---|---|
| Closed | Ash Rosemarie | $36,500 |
Source: Public Records
Tax History Compared to Growth
Tax History
| Year | Tax Paid | Tax Assessment Tax Assessment Total Assessment is a certain percentage of the fair market value that is determined by local assessors to be the total taxable value of land and additions on the property. | Land | Improvement |
|---|---|---|---|---|
| 2025 | $445 | $46,307 | $12,861 | $33,446 |
| 2024 | $445 | $45,400 | $12,609 | $32,791 |
| 2023 | $431 | $44,511 | $12,362 | $32,149 |
| 2022 | $423 | $43,639 | $12,120 | $31,519 |
| 2021 | $416 | $42,784 | $11,883 | $30,901 |
| 2020 | $409 | $42,347 | $11,762 | $30,585 |
| 2019 | $400 | $41,518 | $11,532 | $29,986 |
| 2018 | $397 | $40,705 | $11,306 | $29,399 |
| 2017 | $386 | $39,908 | $11,085 | $28,823 |
| 2016 | $357 | $39,126 | $10,868 | $28,258 |
| 2015 | $348 | $38,539 | $10,705 | $27,834 |
| 2014 | $343 | $37,785 | $10,496 | $27,289 |
Source: Public Records
Map
Nearby Homes
- 741 W D St S
- 540 Glenside Dr
- 22 Sierra Dr
- 950 Woodvale Dr
- 10 Solano Dr
- 16 Solano Dr
- 241 S 1st St
- 160 Lynd Way
- 625 Cypress St
- 230 E Walnut St
- 205 W Cherry St
- 1125 Merrill Ct
- 225 E Chestnut St
- 515 W Cherry St
- 1120 Merrill Ct
- 255 E Chestnut St
- 550 W Creekside Cir
- 1365 Jacobs Place
- 920 N Lincoln St
- 970 Camelia Dr