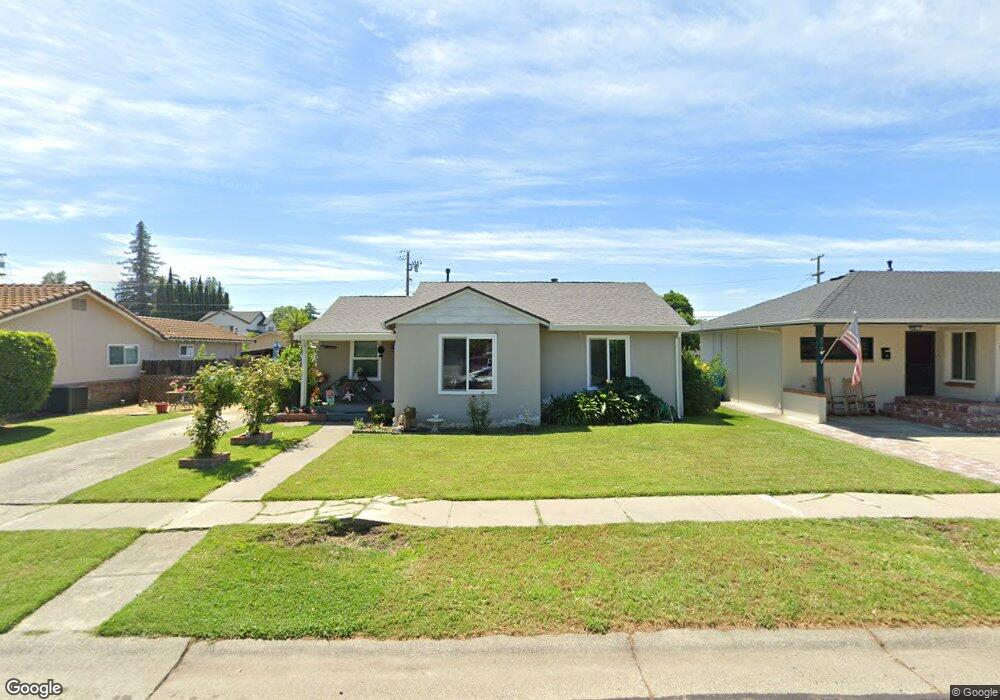
539 W C St Dixon, CA 95620
Dixon AreaEstimated Value: $394,456 - $456,000
About This Home
This home is located at 539 W C St, Dixon, CA 95620 and is currently estimated at $427,614, approximately $501 per square foot. 539 W C St is a home located in Solano County with nearby schools including Anderson (Linford L.) Elementary School, Dixon High School, and Dixon Montessori Charter.
Ownership History
We collect this data history from publicly available records. To have your information removed, we recommend requesting removal directly through your county’s website.
Purchase Details
Purchase Details
Home Financials for this Owner
Home Financials are based on the most recent Mortgage that was taken out on this home.Purchase Details
Home Values in the Area
Average Home Value in this Area
Purchase History
We collect this data history from publicly available records. To have your information removed, we recommend requesting removal directly through your county’s website.
| Date | Buyer | Sale Price | Title Company |
|---|---|---|---|
| -- | None Available | ||
| -- | Financial Title Company | ||
| -- | -- |
Mortgage History
We collect this data history from publicly available records. To have your information removed, we recommend requesting removal directly through your county’s website.
| Date | Status | Borrower | Loan Amount |
|---|---|---|---|
| Closed | $36,500 |
Tax History
We collect this data history from publicly available records. To have your information removed, we recommend requesting removal directly through your county’s website.
| Year | Tax Paid | Tax Assessment Tax Assessment Total Assessment is a certain percentage of the fair market value that is determined by local assessors to be the total taxable value of land and additions on the property. | Land | Improvement |
|---|---|---|---|---|
| 2025 | $445 | $46,307 | $12,861 | $33,446 |
| 2024 | $445 | $45,400 | $12,609 | $32,791 |
| 2023 | $431 | $44,511 | $12,362 | $32,149 |
| 2022 | $423 | $43,639 | $12,120 | $31,519 |
| 2021 | $416 | $42,784 | $11,883 | $30,901 |
| 2020 | $409 | $42,347 | $11,762 | $30,585 |
| 2019 | $400 | $41,518 | $11,532 | $29,986 |
| 2018 | $397 | $40,705 | $11,306 | $29,399 |
| 2017 | $386 | $39,908 | $11,085 | $28,823 |
| 2016 | $357 | $39,126 | $10,868 | $28,258 |
| 2015 | $348 | $38,539 | $10,705 | $27,834 |
| 2014 | $343 | $37,785 | $10,496 | $27,289 |
Map
- 715 Farmgate Ct
- 610 Sierra Dr
- 613 N Adams St
- 850 Sunset Dr
- 51 Solano Dr
- 1440 Goldfield Ln
- 730 Park Dr
- 10 Solano Dr
- 241 S 1st St
- 1430 Roosevelt St
- 700 Moonlight Ct
- 500 Cypress St
- 795 Michele Ct
- 1145 Woodvale Dr
- 520 S 1st St
- 660 Berkshire Dr
- 1680 Gold St
- 1250 Redwood Ct
- 505 Mckenzie Dr
- 575 W Cherry St
Ask me questions while you tour the home.