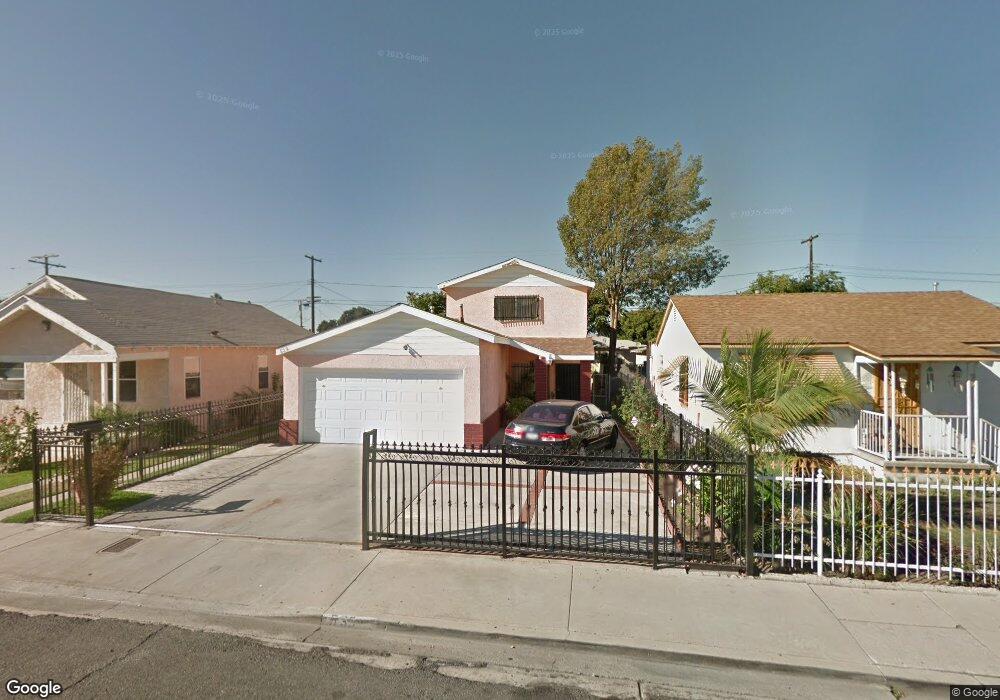
539 W Cressey St Compton, CA 90222
Estimated Value: $575,000 - $639,000
3
Beds
2
Baths
1,558
Sq Ft
$391/Sq Ft
Est. Value
About This Home
This home is located at 539 W Cressey St, Compton, CA 90222 and is currently estimated at $608,692, approximately $390 per square foot. 539 W Cressey St is a home located in Los Angeles County with nearby schools including Washington Elementary School, Benjamin O. Davis Middle School, and Compton High School.
Ownership History
Date
Name
Owned For
Owner Type
Purchase Details
Closed on
Aug 12, 2023
Sold by
Rodriguez Elias and Rodriguez Maria Isabel
Bought by
Rodriguez Lopez Revocable Living Trust and Torres
Current Estimated Value
Purchase Details
Closed on
Dec 10, 2002
Sold by
Federal National Mortgage Association
Bought by
Rodriguez Elias and Rodriguez Maria Isabel
Home Financials for this Owner
Home Financials are based on the most recent Mortgage that was taken out on this home.
Original Mortgage
$116,700
Interest Rate
5.86%
Purchase Details
Closed on
May 6, 2002
Sold by
Delreal Manuel and Delreal Rosa
Bought by
Federal National Mortgage Association
Purchase Details
Closed on
Sep 24, 2001
Sold by
Delreal Manuel and Delreal Rosa
Bought by
Federal National Mortgage Association
Create a Home Valuation Report for This Property
The Home Valuation Report is an in-depth analysis detailing your home's value as well as a comparison with similar homes in the area
Home Values in the Area
Average Home Value in this Area
Purchase History
| Date | Buyer | Sale Price | Title Company |
|---|---|---|---|
| Rodriguez Lopez Revocable Living Trust | -- | None Listed On Document | |
| Rodriguez Elias | $146,000 | Commonwealth Land Title Co | |
| Federal National Mortgage Association | $111,164 | Stewart Title | |
| Federal National Mortgage Association | $99,495 | Stewart Title |
Source: Public Records
Mortgage History
| Date | Status | Borrower | Loan Amount |
|---|---|---|---|
| Previous Owner | Rodriguez Elias | $116,700 |
Source: Public Records
Tax History
| Year | Tax Paid | Tax Assessment Tax Assessment Total Assessment is a certain percentage of the fair market value that is determined by local assessors to be the total taxable value of land and additions on the property. | Land | Improvement |
|---|---|---|---|---|
| 2025 | $4,125 | $211,436 | $114,553 | $96,883 |
| 2024 | $4,125 | $207,291 | $112,307 | $94,984 |
| 2023 | $4,064 | $203,227 | $110,105 | $93,122 |
| 2022 | $3,526 | $199,244 | $107,947 | $91,297 |
| 2021 | $3,551 | $195,338 | $105,831 | $89,507 |
| 2019 | $3,447 | $189,546 | $102,693 | $86,853 |
| 2018 | $3,320 | $185,830 | $100,680 | $85,150 |
| 2016 | $3,147 | $178,616 | $96,771 | $81,845 |
| 2015 | $3,009 | $175,934 | $95,318 | $80,616 |
| 2014 | $2,955 | $172,488 | $93,451 | $79,037 |
Source: Public Records
Map
Nearby Homes
- 521 W Cherry St
- 629 W Plum St
- 522 W Cherry St
- 701 W 139th St
- 720 W Cherry St
- 2062 E Hatchway St
- 720 W 137th St
- 1608 N Grape Ave
- 418 W Spruce St
- 348 W Peach St
- 363 W Spruce St
- 806 W Spruce St
- 2223 E Oris St
- 2107 E Stockwell St
- 1808 N Grape Ave
- 814 W Maple St
- 905 N Hickory Ave
- 2102 E Lucien St
- 836 W Cedar St
- 910 W 138th St
- 541 W Cressey St
- 535 W Cressey St
- 545 W Cressey St
- 529 W Cressey St
- 534 W Peach St
- 540 W Peach St
- 528 W Peach St
- 544 W Peach St
- 1314 N Matthisen Ave
- 527 W Cressey St
- 538 W Cressey St
- 536 W Cressey St
- 532 W Cressey St
- 526 W Peach St
- 530 W Cressey St
- 601 W Cressey St
- 1312 N Matthisen Ave
- 521 W Cressey St
- 522 W Peach St
- 524 W Cressey St
Your Personal Tour Guide
Ask me questions while you tour the home.