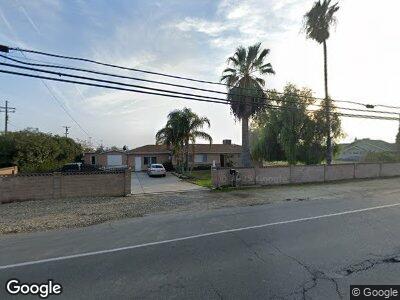
5392 E Jensen Ave Fresno, CA 93725
Cecile NeighborhoodEstimated Value: $322,000 - $509,000
3
Beds
2
Baths
1,800
Sq Ft
$239/Sq Ft
Est. Value
About This Home
This home is located at 5392 E Jensen Ave, Fresno, CA 93725 and is currently estimated at $430,337, approximately $239 per square foot. 5392 E Jensen Ave is a home located in Fresno County with nearby schools including Lone Star Elementary School, Washington Academic Middle School, and Sanger High School.
Ownership History
Date
Name
Owned For
Owner Type
Purchase Details
Closed on
Mar 11, 2002
Sold by
Federal National Mortgage Association
Bought by
Cardenas Martin
Current Estimated Value
Home Financials for this Owner
Home Financials are based on the most recent Mortgage that was taken out on this home.
Original Mortgage
$55,000
Interest Rate
6.84%
Purchase Details
Closed on
Feb 14, 2002
Sold by
Principal Wholesale Mtg Inc
Bought by
Federal National Mortgage Association
Home Financials for this Owner
Home Financials are based on the most recent Mortgage that was taken out on this home.
Original Mortgage
$55,000
Interest Rate
6.84%
Purchase Details
Closed on
Aug 30, 2001
Sold by
Principal Wholesale Mtg Inc
Bought by
Federal National Mortgage Association
Purchase Details
Closed on
Aug 10, 2001
Sold by
Olk Henry
Bought by
Principal Wholesale Mtg Inc
Create a Home Valuation Report for This Property
The Home Valuation Report is an in-depth analysis detailing your home's value as well as a comparison with similar homes in the area
Home Values in the Area
Average Home Value in this Area
Purchase History
| Date | Buyer | Sale Price | Title Company |
|---|---|---|---|
| Cardenas Martin | $88,000 | Fidelity National Title Co | |
| Federal National Mortgage Association | -- | Stewart Title | |
| Principal Wholesale Mtg Inc | $58,342 | Stewart Title |
Source: Public Records
Mortgage History
| Date | Status | Borrower | Loan Amount |
|---|---|---|---|
| Open | Torres Juan P | $154,600 | |
| Closed | Torres Juan | $8,160 | |
| Closed | Cardenas Martin | $55,000 | |
| Previous Owner | Olk Henry | $70,000 |
Source: Public Records
Tax History Compared to Growth
Tax History
| Year | Tax Paid | Tax Assessment Tax Assessment Total Assessment is a certain percentage of the fair market value that is determined by local assessors to be the total taxable value of land and additions on the property. | Land | Improvement |
|---|---|---|---|---|
| 2023 | $5,503 | $219,928 | $136,412 | $83,516 |
| 2022 | $5,345 | $215,617 | $133,738 | $81,879 |
| 2021 | $5,317 | $211,390 | $131,116 | $80,274 |
| 2020 | $5,191 | $209,223 | $129,772 | $79,451 |
| 2019 | $5,135 | $205,122 | $127,228 | $77,894 |
| 2018 | $5,022 | $201,101 | $124,734 | $76,367 |
| 2017 | $4,956 | $197,159 | $122,289 | $74,870 |
| 2016 | $2,276 | $193,294 | $119,892 | $73,402 |
| 2015 | $2,293 | $190,392 | $118,092 | $72,300 |
| 2014 | $2,262 | $186,663 | $115,779 | $70,884 |
Source: Public Records
Map
Nearby Homes
- 5275 E Hoxie Ave
- 5254 E Jensen Ave
- 5357 E Burns Ave
- 5375 E Eugenia Ave
- 5266 E Harvest Ln
- 2380 S Sabre Ave
- 2575 S Willow Ave Unit 118
- 2575 S Willow Ave Unit 165
- 2575 S Willow Ave Unit 156
- 2575 S Willow Ave Unit 46
- 2575 S Willow Ave Unit 164
- 2575 S Willow Ave Unit 167
- 5588 E Pitt Ave
- 5140 E Belgravia Ave
- 5157 E Truman Ave
- 2485 S Manila Ave
- 5160 E Florence Ave
- 2148 S Villa Ave
- 2594 S Duke Ave
- 2449 S Willow Ave
- 5392 E Jensen Ave
- 5380 E Jensen Ave
- 5372 E Jensen Ave
- 5408 E Jensen Ave
- 5360 E Jensen Ave
- 2595 S Lind Ave
- 2589 S Lind Ave
- 2585 S Lind Ave
- 2579 S Lind Ave
- 2573 S Lind Ave
- 2567 S Lind Ave
- 5335 E Hoxie Ave
- 2561 S Lind Ave
- 5336 E Chapman Ave
- 2555 S Lind Ave
- 5327 E Hoxie Ave
- 5408 E Kaviland Ave
- 5412 E Kaviland Ave
- 5328 E Chapman Ave
- 5341 E Chapman Ave