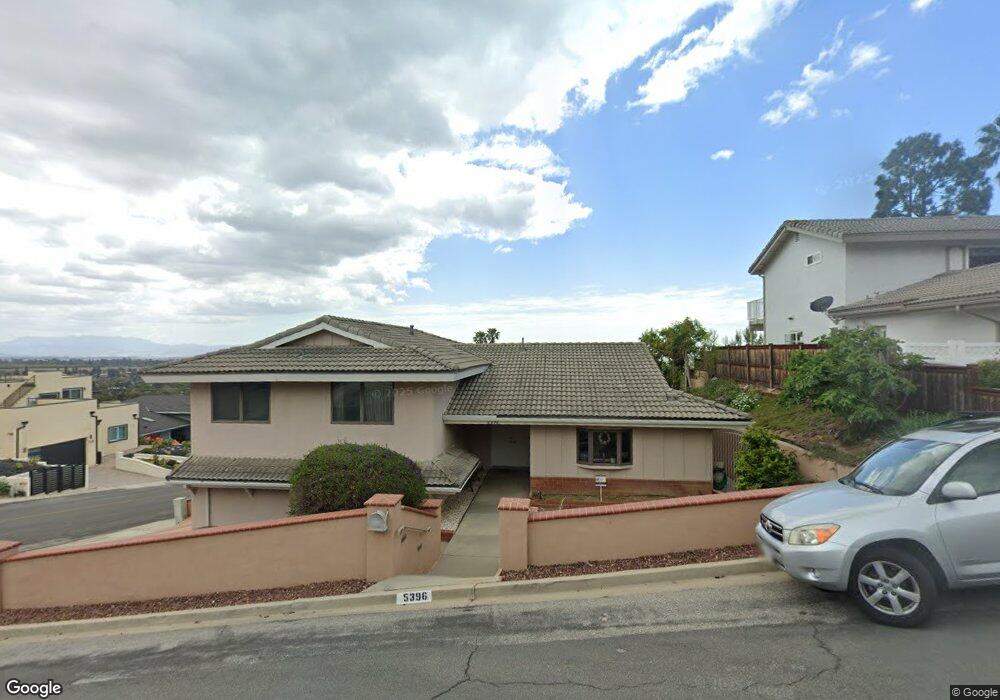
5396 Edgehill Cir Ventura, CA 93003
College NeighborhoodEstimated Value: $1,236,810 - $1,560,000
4
Beds
3
Baths
2,274
Sq Ft
$640/Sq Ft
Est. Value
About This Home
This home is located at 5396 Edgehill Cir, Ventura, CA 93003 and is currently estimated at $1,455,203, approximately $639 per square foot. 5396 Edgehill Cir is a home located in Ventura County with nearby schools including Poinsettia Elementary School, Cabrillo Middle School, and Ventura High School.
Ownership History
Date
Name
Owned For
Owner Type
Purchase Details
Closed on
Feb 24, 2014
Sold by
Heller James L and Ecklund Carol F
Bought by
Heller James L and Revocab Carol F Ecklund
Current Estimated Value
Purchase Details
Closed on
Nov 19, 1998
Sold by
Keith Trever and Keith Christina
Bought by
Heller James L and Ecklund Carol F
Home Financials for this Owner
Home Financials are based on the most recent Mortgage that was taken out on this home.
Original Mortgage
$261,600
Outstanding Balance
$58,711
Interest Rate
6.91%
Estimated Equity
$1,396,492
Purchase Details
Closed on
Jan 29, 1997
Sold by
Gillette Howard & Janice F Trust and Janice F
Bought by
Keith Trever and Keith Christina
Home Financials for this Owner
Home Financials are based on the most recent Mortgage that was taken out on this home.
Original Mortgage
$181,500
Interest Rate
7.86%
Purchase Details
Closed on
Oct 31, 1994
Sold by
Gillette Janice F
Bought by
Gillette Janice F
Create a Home Valuation Report for This Property
The Home Valuation Report is an in-depth analysis detailing your home's value as well as a comparison with similar homes in the area
Home Values in the Area
Average Home Value in this Area
Purchase History
| Date | Buyer | Sale Price | Title Company |
|---|---|---|---|
| Heller James L | -- | None Available | |
| Heller James L | $327,000 | First American Title Ins Co | |
| Keith Trever | $242,000 | American Title Co | |
| Gillette Janice F | -- | -- |
Source: Public Records
Mortgage History
| Date | Status | Borrower | Loan Amount |
|---|---|---|---|
| Open | Heller James L | $261,600 | |
| Previous Owner | Keith Trever | $181,500 | |
| Closed | Keith Trever | $36,300 |
Source: Public Records
Tax History Compared to Growth
Tax History
| Year | Tax Paid | Tax Assessment Tax Assessment Total Assessment is a certain percentage of the fair market value that is determined by local assessors to be the total taxable value of land and additions on the property. | Land | Improvement |
|---|---|---|---|---|
| 2025 | $5,552 | $518,732 | $204,415 | $314,317 |
| 2024 | $5,552 | $508,561 | $200,407 | $308,154 |
| 2023 | $5,489 | $498,590 | $196,478 | $302,112 |
| 2022 | $5,103 | $488,814 | $192,625 | $296,189 |
| 2021 | $5,014 | $479,230 | $188,848 | $290,382 |
| 2020 | $4,968 | $474,317 | $186,912 | $287,405 |
| 2019 | $4,877 | $465,018 | $183,248 | $281,770 |
| 2018 | $4,795 | $455,901 | $179,655 | $276,246 |
| 2017 | $4,706 | $446,963 | $176,133 | $270,830 |
| 2016 | $4,623 | $438,200 | $172,680 | $265,520 |
| 2015 | $4,548 | $431,620 | $170,087 | $261,533 |
| 2014 | $4,483 | $423,167 | $166,756 | $256,411 |
Source: Public Records
Map
Nearby Homes
- 572 Skyline Rd
- 5438 Rainier St
- 288 Byron Ave
- 275 Fairfax Ave
- 262 Crestwood Ave
- 412 Dayloma Ave
- 5633 Pembroke St
- 4797 Loma Vista Rd
- 6005 Sutter St
- 6153 Cobblestone Dr
- 6174 Cobblestone Dr
- 159 Donner Ave
- 146 Donner Ave
- 201 Xavier Ave
- 5535 Larkin St
- 91 Mount Whitney Ct
- 5365 Queens St
- 4205 Foothill Rd
- 708 Skyview Terrace
- 6019 Cloverly St
- 5382 Edgehill Cir
- 523 Skyline Rd
- 5381 Cliffside Cir
- 536 Skyline Rd
- 528 Skyline Rd
- 5362 Edgehill Cir
- 555 Skyline Rd
- 5383 Edgehill Cir
- 552 Skyline Rd
- 5361 Cliffside Cir
- 524 Skyline Rd
- 5363 Edgehill Cir
- 560 Skyline Rd
- 5349 Cliffside Cir
- 5350 Edgehill Cir
- 5398 Grandview Ct
- 539 Valley View Way
- 531 Valley View Way
- 5394 Cliffside Cir
- 5380 Cliffside Cir