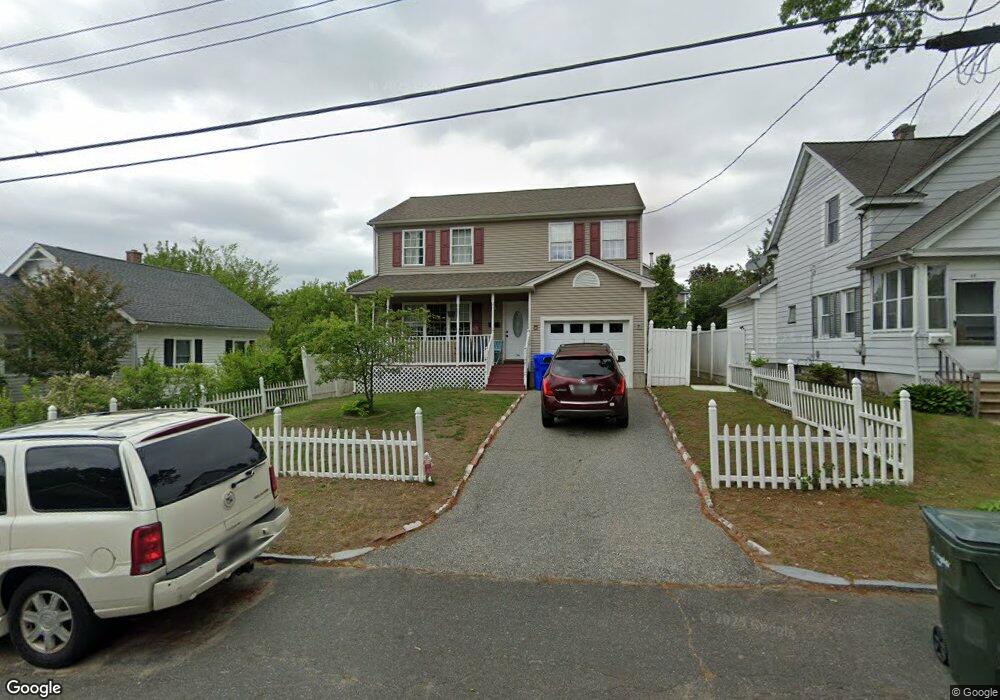
54 Agnes St Springfield, MA 01118
East Forest Park NeighborhoodEstimated Value: $331,000 - $374,000
3
Beds
2
Baths
1,492
Sq Ft
$236/Sq Ft
Est. Value
About This Home
This home is located at 54 Agnes St, Springfield, MA 01118 and is currently estimated at $351,667, approximately $235 per square foot. 54 Agnes St is a home located in Hampden County with nearby schools including Mary A. Dryden Veterans Memorial School, M Marcus Kiley Middle, and Springfield High School of Science and Technology.
Ownership History
Date
Name
Owned For
Owner Type
Purchase Details
Closed on
Dec 1, 2017
Sold by
Kamau Pius M
Bought by
Cig 2 Llc
Current Estimated Value
Purchase Details
Closed on
Jan 14, 2005
Sold by
Sugar Magnolia Rt
Bought by
Kamau Pius M
Home Financials for this Owner
Home Financials are based on the most recent Mortgage that was taken out on this home.
Original Mortgage
$179,900
Interest Rate
5.81%
Mortgage Type
Purchase Money Mortgage
Create a Home Valuation Report for This Property
The Home Valuation Report is an in-depth analysis detailing your home's value as well as a comparison with similar homes in the area
Home Values in the Area
Average Home Value in this Area
Purchase History
| Date | Buyer | Sale Price | Title Company |
|---|---|---|---|
| Cig 2 Llc | $133,000 | -- | |
| Kamau Pius M | $179,900 | -- |
Source: Public Records
Mortgage History
| Date | Status | Borrower | Loan Amount |
|---|---|---|---|
| Previous Owner | Kamau Pius M | $179,900 |
Source: Public Records
Tax History
| Year | Tax Paid | Tax Assessment Tax Assessment Total Assessment is a certain percentage of the fair market value that is determined by local assessors to be the total taxable value of land and additions on the property. | Land | Improvement |
|---|---|---|---|---|
| 2025 | $4,820 | $307,400 | $45,200 | $262,200 |
| 2024 | $4,680 | $291,400 | $45,200 | $246,200 |
| 2023 | $4,291 | $251,700 | $43,100 | $208,600 |
| 2022 | $4,199 | $223,100 | $43,100 | $180,000 |
| 2021 | $3,965 | $219,600 | $39,200 | $180,400 |
| 2020 | $4,256 | $217,900 | $39,200 | $178,700 |
| 2019 | $3,785 | $199,000 | $39,200 | $159,800 |
| 2018 | $0 | $200,700 | $39,200 | $161,500 |
| 2017 | $3,918 | $199,300 | $39,200 | $160,100 |
| 2016 | $3,553 | $180,700 | $39,200 | $141,500 |
| 2015 | $3,663 | $186,200 | $39,200 | $147,000 |
Source: Public Records
Map
Nearby Homes
Your Personal Tour Guide
Ask me questions while you tour the home.