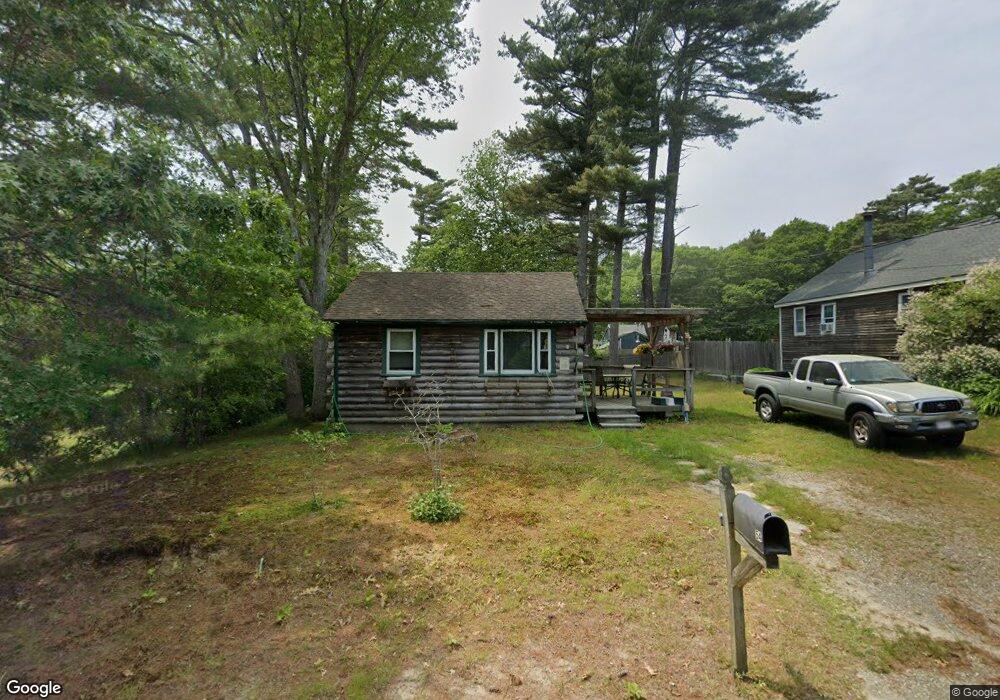
54 Cypress St Plymouth, MA 02360
Estimated Value: $333,000 - $406,000
2
Beds
1
Bath
640
Sq Ft
$572/Sq Ft
Est. Value
About This Home
This home is located at 54 Cypress St, Plymouth, MA 02360 and is currently estimated at $365,834, approximately $571 per square foot. 54 Cypress St is a home located in Plymouth County with nearby schools including South Elementary School, Plymouth South Middle School, and Plymouth South High School.
Ownership History
Date
Name
Owned For
Owner Type
Purchase Details
Closed on
Aug 22, 2003
Sold by
Jones Christopher D
Bought by
Monsini Anke
Current Estimated Value
Purchase Details
Closed on
Apr 21, 2000
Sold by
Gurney Joanne Marie
Bought by
Jones Christopher D and Desroches Teresa J
Purchase Details
Closed on
Dec 28, 1989
Sold by
Klasson Wayne K
Bought by
Gurney Joanne M
Create a Home Valuation Report for This Property
The Home Valuation Report is an in-depth analysis detailing your home's value as well as a comparison with similar homes in the area
Home Values in the Area
Average Home Value in this Area
Purchase History
| Date | Buyer | Sale Price | Title Company |
|---|---|---|---|
| Monsini Anke | $150,000 | -- | |
| Jones Christopher D | $89,900 | -- | |
| Gurney Joanne M | $64,500 | -- |
Source: Public Records
Mortgage History
| Date | Status | Borrower | Loan Amount |
|---|---|---|---|
| Open | Gurney Joanne M | $8,344 | |
| Open | Gurney Joanne M | $16,656 | |
| Open | Gurney Joanne M | $223,000 |
Source: Public Records
Tax History Compared to Growth
Tax History
| Year | Tax Paid | Tax Assessment Tax Assessment Total Assessment is a certain percentage of the fair market value that is determined by local assessors to be the total taxable value of land and additions on the property. | Land | Improvement |
|---|---|---|---|---|
| 2025 | $3,475 | $273,800 | $167,000 | $106,800 |
| 2024 | $3,384 | $262,900 | $163,500 | $99,400 |
| 2023 | $3,323 | $242,400 | $142,800 | $99,600 |
| 2022 | $3,151 | $204,200 | $129,800 | $74,400 |
| 2021 | $3,119 | $193,000 | $129,800 | $63,200 |
| 2020 | $2,863 | $175,100 | $113,700 | $61,400 |
| 2019 | $2,689 | $162,600 | $101,200 | $61,400 |
| 2018 | $2,550 | $154,900 | $93,500 | $61,400 |
| 2017 | $2,467 | $148,800 | $93,500 | $55,300 |
| 2016 | $2,216 | $136,200 | $80,900 | $55,300 |
| 2015 | $2,191 | $141,000 | $85,700 | $55,300 |
| 2014 | $2,201 | $145,500 | $90,400 | $55,100 |
Source: Public Records
Map
Nearby Homes
- 110 Packard St
- 14 Buttonwood Ln
- 23 Pine Ridge Rd
- 11 Thompson Rd Unit 11A
- 11 Thompson Rd Unit A
- 27 Baker Ln Unit 27H
- 13 Hideaway Village Unit G
- 9 Hideaway Rd Unit F
- 810 Head of The Bay Rd
- 18 Martin St
- 73 Lewis Point Rd
- 65 Lewis Point Rd
- 0 Lewis Point Rd
- 3 Wolf Rd
- 3132 Cranberry Hwy Unit 59
- 41 Lewis Point Rd
- 56 Rip Van Winkle Way
- 69 Bay Pointe Drive Extension Unit 69
- 45 Bay Pointe Drive Extension Unit 45
- 13 Bay Pointe Drive Extension Unit 13