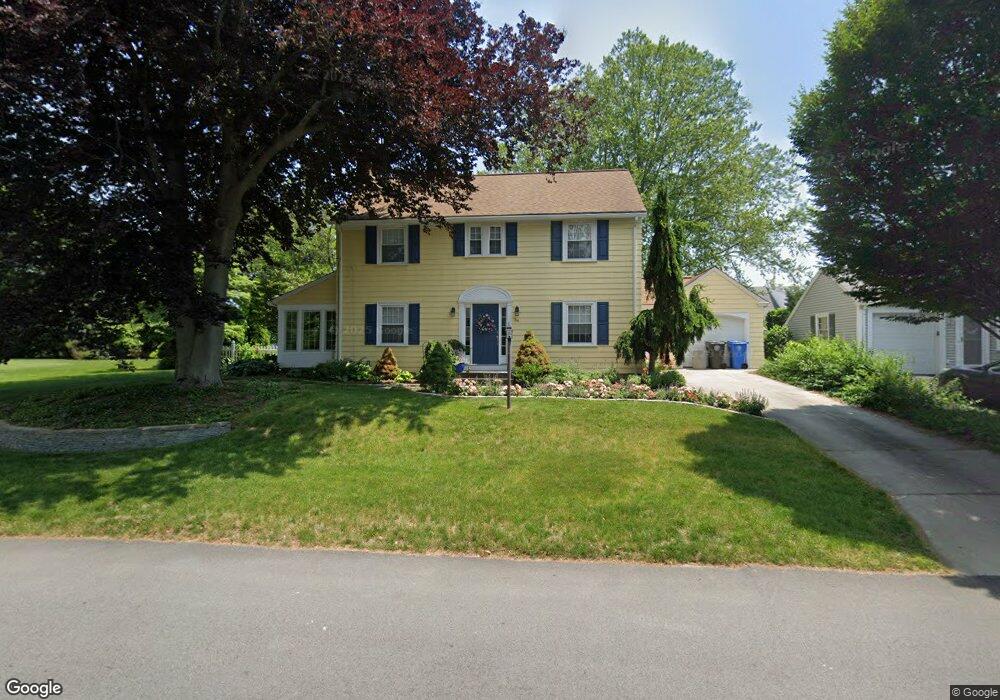
54 Forest Ave Cranston, RI 02910
Eden Park NeighborhoodEstimated Value: $453,000 - $516,000
3
Beds
2
Baths
1,684
Sq Ft
$283/Sq Ft
Est. Value
About This Home
This home is located at 54 Forest Ave, Cranston, RI 02910 and is currently estimated at $477,351, approximately $283 per square foot. 54 Forest Ave is a home located in Providence County with nearby schools including Daniel D. Waterman School, Park View Middle School, and Cranston High School East.
Ownership History
Date
Name
Owned For
Owner Type
Purchase Details
Closed on
Oct 13, 1999
Sold by
Andrews Arlene A
Bought by
Hoyle Dennis E
Current Estimated Value
Home Financials for this Owner
Home Financials are based on the most recent Mortgage that was taken out on this home.
Original Mortgage
$98,000
Interest Rate
7.8%
Create a Home Valuation Report for This Property
The Home Valuation Report is an in-depth analysis detailing your home's value as well as a comparison with similar homes in the area
Home Values in the Area
Average Home Value in this Area
Purchase History
| Date | Buyer | Sale Price | Title Company |
|---|---|---|---|
| Hoyle Dennis E | $134,000 | -- |
Source: Public Records
Mortgage History
| Date | Status | Borrower | Loan Amount |
|---|---|---|---|
| Closed | Hoyle Dennis E | $70,000 | |
| Open | Hoyle Dennis E | $232,750 | |
| Closed | Hoyle Dennis E | $94,000 | |
| Closed | Hoyle Dennis E | $98,000 |
Source: Public Records
Tax History Compared to Growth
Tax History
| Year | Tax Paid | Tax Assessment Tax Assessment Total Assessment is a certain percentage of the fair market value that is determined by local assessors to be the total taxable value of land and additions on the property. | Land | Improvement |
|---|---|---|---|---|
| 2025 | $5,473 | $394,300 | $113,100 | $281,200 |
| 2024 | $5,366 | $394,300 | $113,100 | $281,200 |
| 2023 | $5,315 | $281,200 | $74,500 | $206,700 |
| 2022 | $5,205 | $281,200 | $74,500 | $206,700 |
| 2021 | $5,062 | $281,200 | $74,500 | $206,700 |
| 2020 | $4,912 | $236,500 | $70,900 | $165,600 |
| 2019 | $4,912 | $236,500 | $70,900 | $165,600 |
| 2018 | $4,799 | $236,500 | $70,900 | $165,600 |
| 2017 | $4,845 | $211,200 | $63,800 | $147,400 |
| 2016 | $4,741 | $211,200 | $63,800 | $147,400 |
| 2015 | $4,741 | $211,200 | $63,800 | $147,400 |
| 2014 | $4,330 | $189,600 | $63,800 | $125,800 |
Source: Public Records
Map
Nearby Homes
- 638 Pontiac Ave
- 75 Dale Ave
- 18 Glenwood Ave
- 10 Woburn St
- 47 Holburn Ave
- 366 Woodbine St
- 96 Mason Ave
- 150 Riverside Ave
- 105 Fordson Ave
- 36 Blackamore Ave
- 859 Pontiac Ave
- 181 Grace St
- 124 Clarence St
- 25 Sharon St Unit 2
- 152 Woodbine St
- 38 Bridgton Rd
- 129 1st Ave
- 90 Garden St
- 288 Pontiac Ave
- 4 Crossway Rd