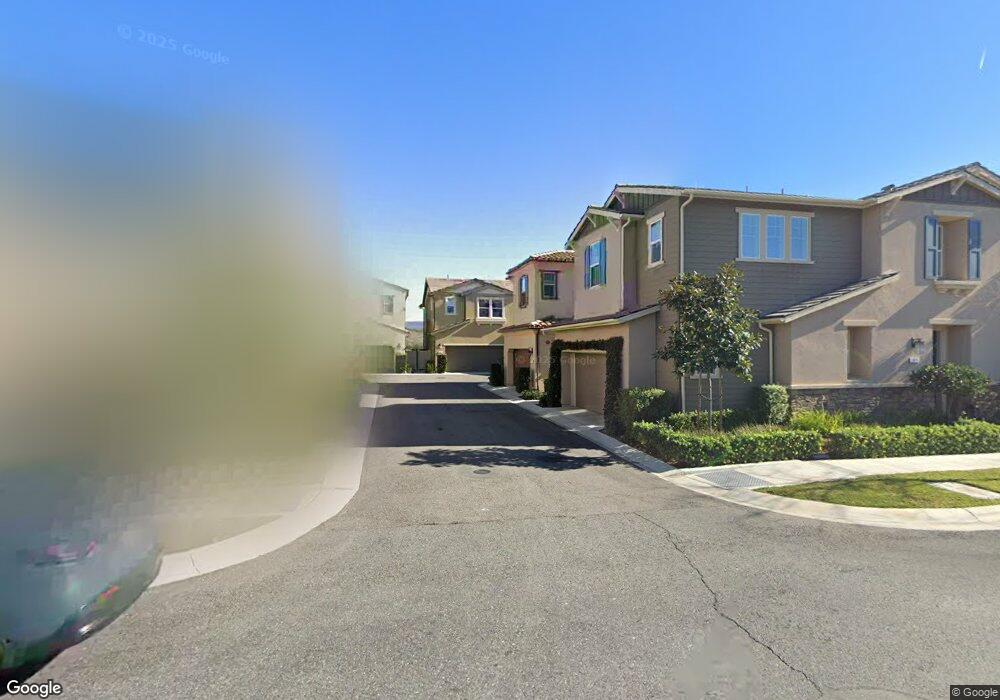
54 Fosco St Rancho Mission Viejo, CA 92694
Estimated Value: $1,183,754 - $1,491,000
3
Beds
3
Baths
1,927
Sq Ft
$660/Sq Ft
Est. Value
About This Home
This home is located at 54 Fosco St, Rancho Mission Viejo, CA 92694 and is currently estimated at $1,271,689, approximately $659 per square foot. 54 Fosco St is a home with nearby schools including Esencia and Tesoro High School.
Ownership History
Date
Name
Owned For
Owner Type
Purchase Details
Closed on
Jun 12, 2024
Sold by
Lubinsky Paul Sylvain
Bought by
Psl Trust and Lubinsky
Current Estimated Value
Purchase Details
Closed on
Sep 10, 2018
Sold by
Lubinsky Ozella
Bought by
Lubinsky Bradley Ross
Home Financials for this Owner
Home Financials are based on the most recent Mortgage that was taken out on this home.
Original Mortgage
$76,095
Interest Rate
4.5%
Mortgage Type
Credit Line Revolving
Purchase Details
Closed on
Jun 20, 2018
Sold by
Tri Pointe Homes Inc
Bought by
Lubinsky Bradley Ross and Lubinsky Paul Sylvain
Home Financials for this Owner
Home Financials are based on the most recent Mortgage that was taken out on this home.
Original Mortgage
$614,912
Interest Rate
4.37%
Mortgage Type
Adjustable Rate Mortgage/ARM
Create a Home Valuation Report for This Property
The Home Valuation Report is an in-depth analysis detailing your home's value as well as a comparison with similar homes in the area
Home Values in the Area
Average Home Value in this Area
Purchase History
| Date | Buyer | Sale Price | Title Company |
|---|---|---|---|
| Psl Trust | -- | None Listed On Document | |
| Lubinsky Bradley Ross | -- | First American Title Co | |
| Lubinsky Paul Sylvain | -- | First American Title | |
| Lubinsky Bradley Ross | $769,000 | First American Title |
Source: Public Records
Mortgage History
| Date | Status | Borrower | Loan Amount |
|---|---|---|---|
| Previous Owner | Lubinsky Bradley Ross | $76,095 | |
| Previous Owner | Lubinsky Bradley Ross | $614,912 |
Source: Public Records
Tax History Compared to Growth
Tax History
| Year | Tax Paid | Tax Assessment Tax Assessment Total Assessment is a certain percentage of the fair market value that is determined by local assessors to be the total taxable value of land and additions on the property. | Land | Improvement |
|---|---|---|---|---|
| 2025 | $14,182 | $857,430 | $449,149 | $408,281 |
| 2024 | $14,182 | $840,618 | $440,342 | $400,276 |
| 2023 | $14,134 | $824,136 | $431,708 | $392,428 |
| 2022 | $13,885 | $807,977 | $423,243 | $384,734 |
| 2021 | $13,703 | $792,135 | $414,944 | $377,191 |
| 2020 | $13,420 | $784,013 | $410,689 | $373,324 |
| 2019 | $14,013 | $768,641 | $402,637 | $366,004 |
| 2018 | $9,740 | $331,354 | $331,354 | $0 |
| 2017 | $7,496 | $324,857 | $324,857 | $0 |
Source: Public Records
Map
Nearby Homes