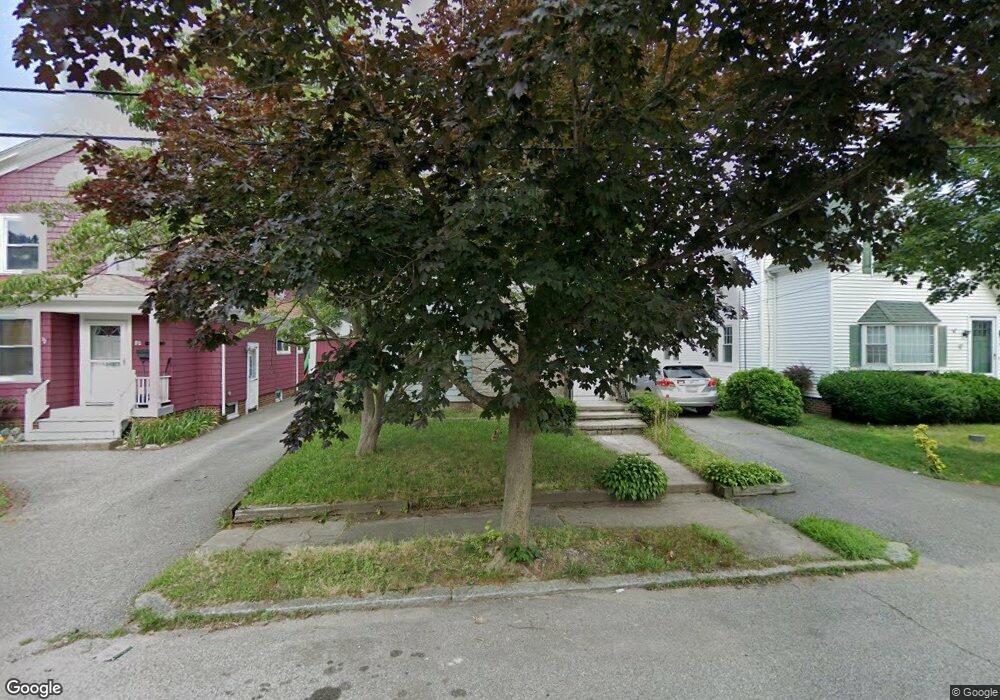
54 Lyndon Rd Cranston, RI 02905
Edgewood NeighborhoodEstimated Value: $433,000 - $494,000
4
Beds
2
Baths
2,100
Sq Ft
$221/Sq Ft
Est. Value
About This Home
This home is located at 54 Lyndon Rd, Cranston, RI 02905 and is currently estimated at $463,940, approximately $220 per square foot. 54 Lyndon Rd is a home located in Providence County with nearby schools including Edgewood Highland Elementary School, Edward S. Rhodes School, and Park View Middle School.
Ownership History
Date
Name
Owned For
Owner Type
Purchase Details
Closed on
Nov 23, 2024
Sold by
Merced Santos S
Bought by
Merced Santos S and Merced Julia V
Current Estimated Value
Purchase Details
Closed on
Sep 28, 2001
Sold by
Davis Michael and Davis Marilyn
Bought by
Merad Santos S
Home Financials for this Owner
Home Financials are based on the most recent Mortgage that was taken out on this home.
Original Mortgage
$122,053
Interest Rate
6.91%
Create a Home Valuation Report for This Property
The Home Valuation Report is an in-depth analysis detailing your home's value as well as a comparison with similar homes in the area
Home Values in the Area
Average Home Value in this Area
Purchase History
| Date | Buyer | Sale Price | Title Company |
|---|---|---|---|
| Merced Santos S | -- | None Available | |
| Merced Santos S | -- | None Available | |
| Merced Santos S | -- | None Available | |
| Merad Santos S | $124,000 | -- | |
| Merad Santos S | $124,000 | -- |
Source: Public Records
Mortgage History
| Date | Status | Borrower | Loan Amount |
|---|---|---|---|
| Previous Owner | Merad Santos S | $114,543 | |
| Previous Owner | Merad Santos S | $18,100 | |
| Previous Owner | Merad Santos S | $136,000 | |
| Previous Owner | Merad Santos S | $122,053 |
Source: Public Records
Tax History
| Year | Tax Paid | Tax Assessment Tax Assessment Total Assessment is a certain percentage of the fair market value that is determined by local assessors to be the total taxable value of land and additions on the property. | Land | Improvement |
|---|---|---|---|---|
| 2025 | $5,244 | $377,800 | $102,500 | $275,300 |
| 2024 | $5,142 | $377,800 | $102,500 | $275,300 |
| 2023 | $4,855 | $256,900 | $67,500 | $189,400 |
| 2022 | $4,755 | $256,900 | $67,500 | $189,400 |
| 2021 | $4,624 | $256,900 | $67,500 | $189,400 |
| 2020 | $4,304 | $207,200 | $64,300 | $142,900 |
| 2019 | $4,304 | $207,200 | $64,300 | $142,900 |
| 2018 | $4,204 | $207,200 | $64,300 | $142,900 |
| 2017 | $4,193 | $182,800 | $57,900 | $124,900 |
| 2016 | $4,104 | $182,800 | $57,900 | $124,900 |
| 2015 | $4,104 | $182,800 | $57,900 | $124,900 |
| 2014 | $3,881 | $169,900 | $57,900 | $112,000 |
Source: Public Records
Map
Nearby Homes
- 27 Cliffdale Ave
- 29 Malvern Ave
- 42 Netherlands Ave
- 10 Sylvan Ave
- 73 Western Promenade
- 78 Villa Ave
- 63 Taft St
- 73 Moorland Ave
- 68 Ferncrest Ave
- 94 Holmes Rd
- 115 Irving Rd
- 19 Warwick Ave
- 27 Vickery St
- 172 Bluff Ave
- 126 Columbia Ave
- 210 Irving Rd
- 65 Perkins Ave
- 545 Park Ave
- 129 1st Ave
- 1302 Elmwood Ave
Your Personal Tour Guide
Ask me questions while you tour the home.